Sector Deep Dive · Beverages
Assessing Physical and Transition Climate Risk in Beverages: Carlsberg Group
A CRFM deep dive into water stress and carbon transition exposure across a global brewer's asset base.
Shrinivash D Kannan · 15 July 2026 · 10 min read
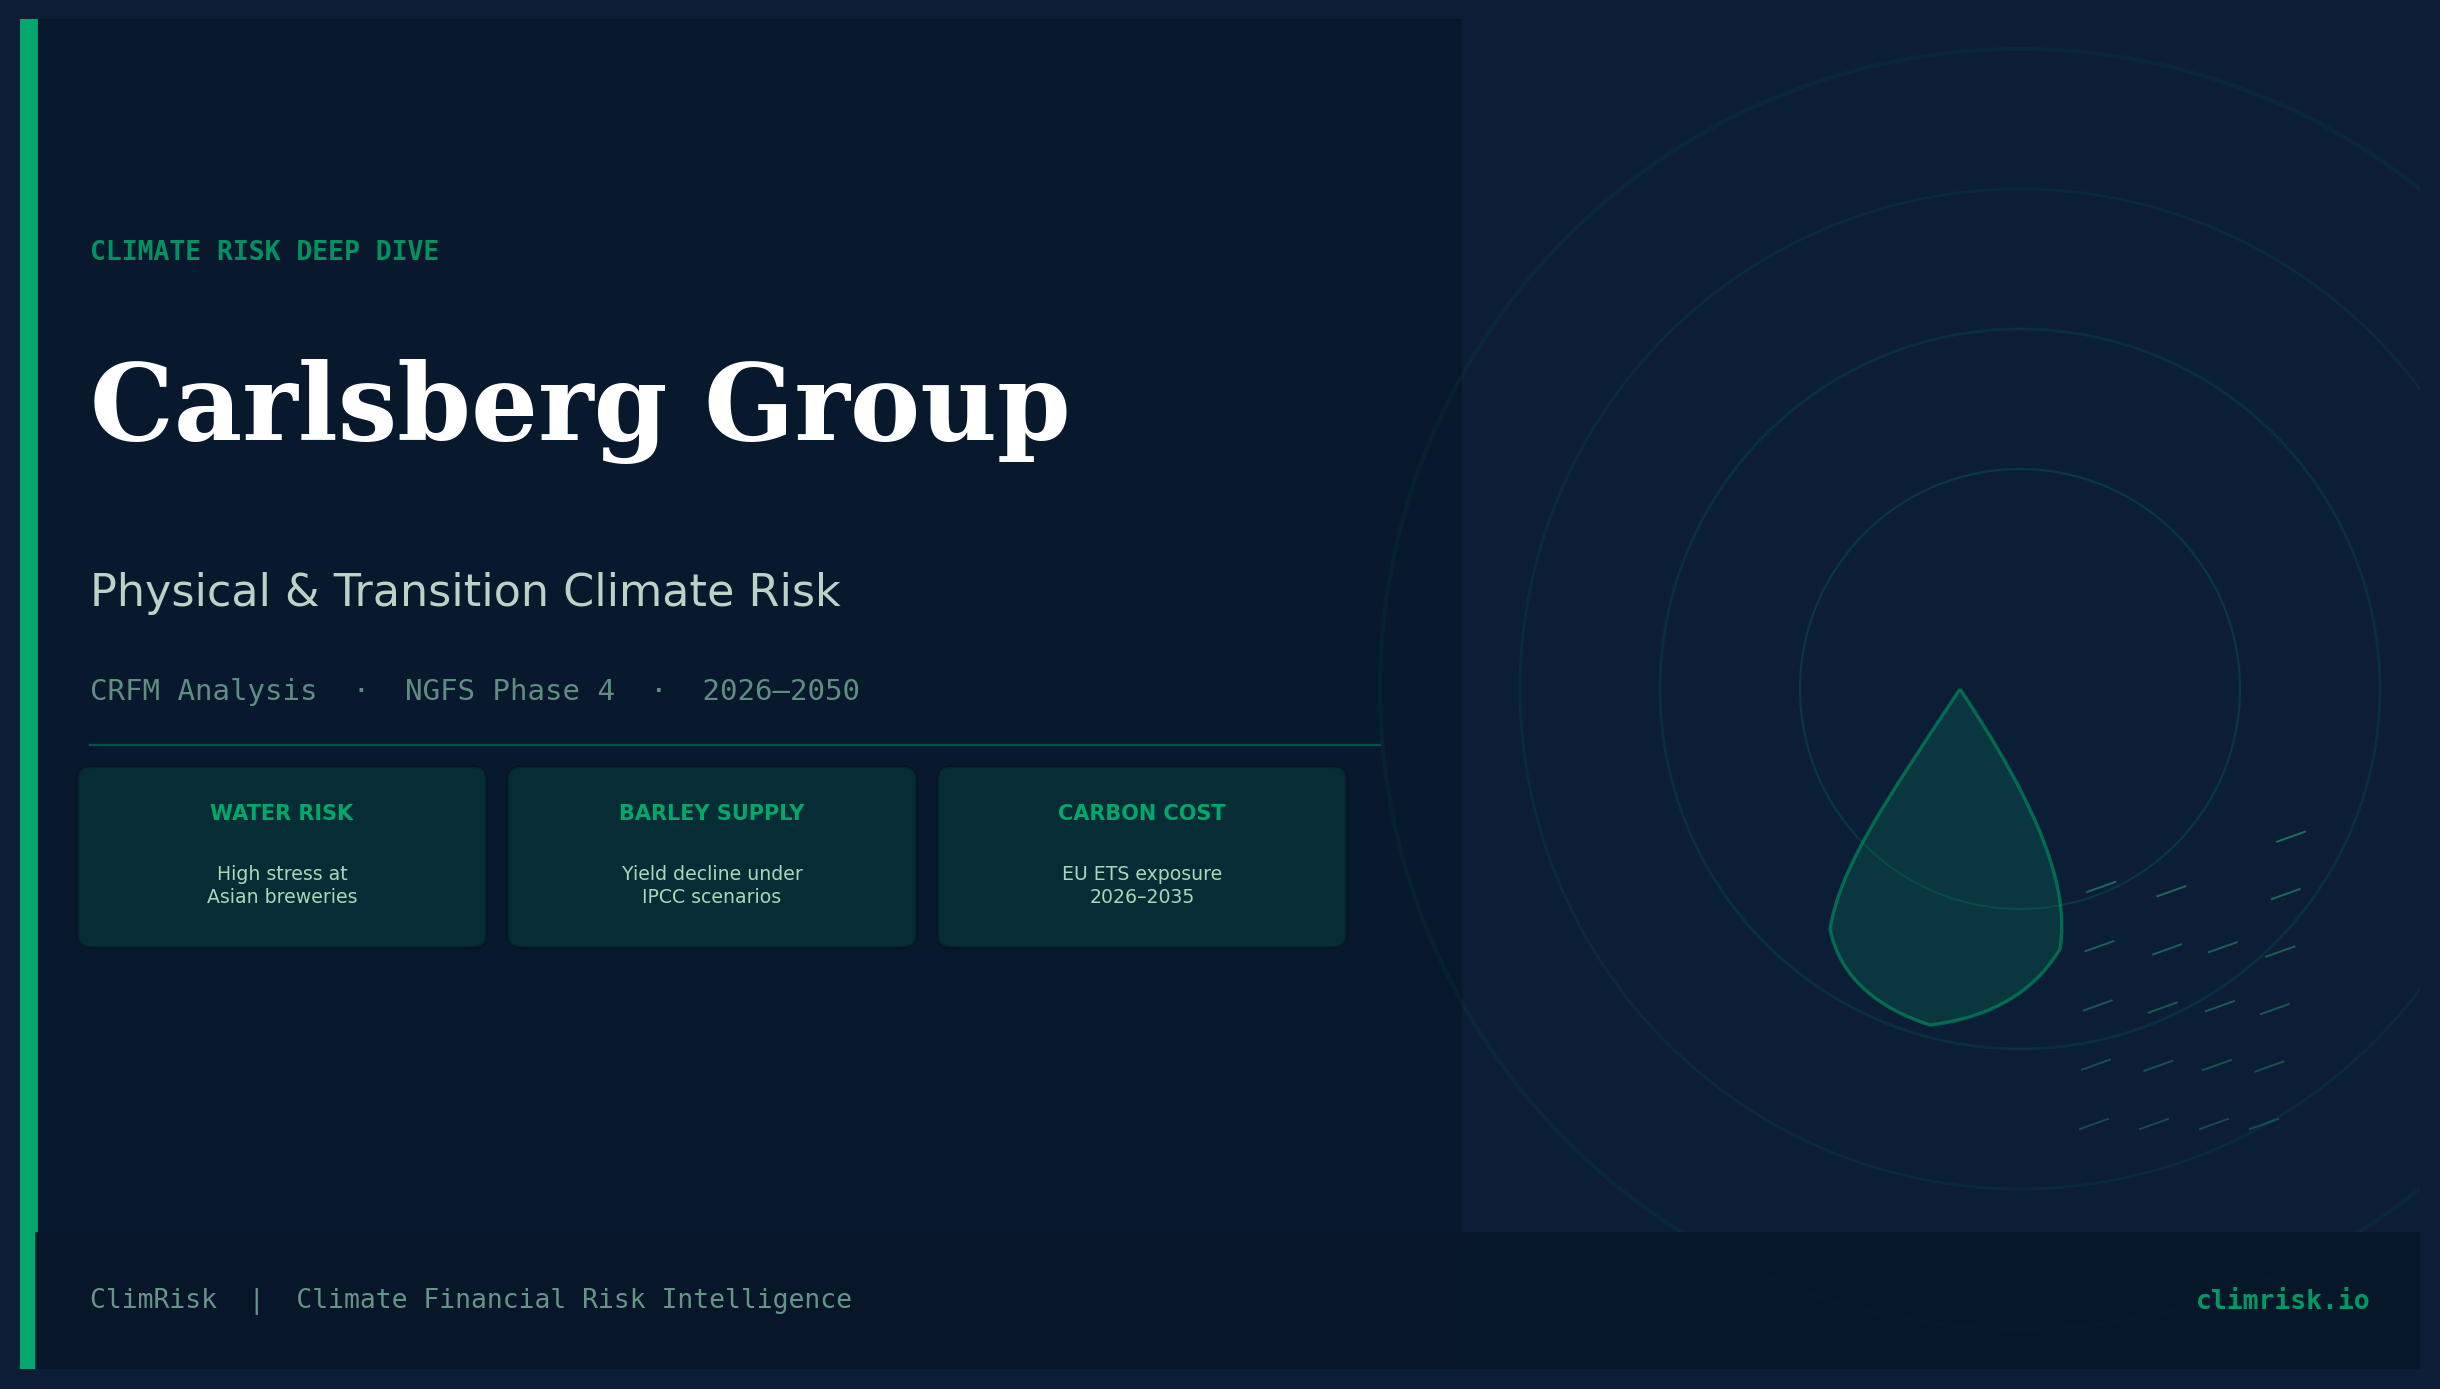
Carlsberg sells beer in 40+ markets across six continents. Every single litre it produces starts with barley, water, and energy.
Barley yields are falling in drought years. Water stress is intensifying across South Asia and Northwest China where Carlsberg has active breweries. The EU carbon price — which directly hits Carlsberg's European manufacturing operations — reached €65 per tonne in 2023 and is projected to nearly double by 2030 under the Net Zero pathway.
Carlsberg has one of the more detailed sustainability programmes in the global beverage sector. "Together Towards ZERO and Beyond" is a genuine strategy with real targets. But sustainability targets and financial impact quantification are two different things.
This piece runs Carlsberg's climate exposure through a structured Climate Risk Financial Modelling (CRFM) framework — physical risk at the asset level, transition risk under three NGFS scenarios, and what both mean for enterprise value and EBITDA through 2050.
Why Carlsberg Is a Particularly Interesting Case
Most climate risk analysis in the beverage sector focuses on Scope 1 and 2 emissions because they are the easiest to measure and disclose. Carlsberg's own reporting is strong on this — Scope 1+2 emissions were approximately 330,000 tCO2e in 2022, and the company is targeting net zero on those by 2040.
That number matters. But it is not the number that most investors should worry about.
The real climate financial exposure in brewing is structural, and it sits in three places:
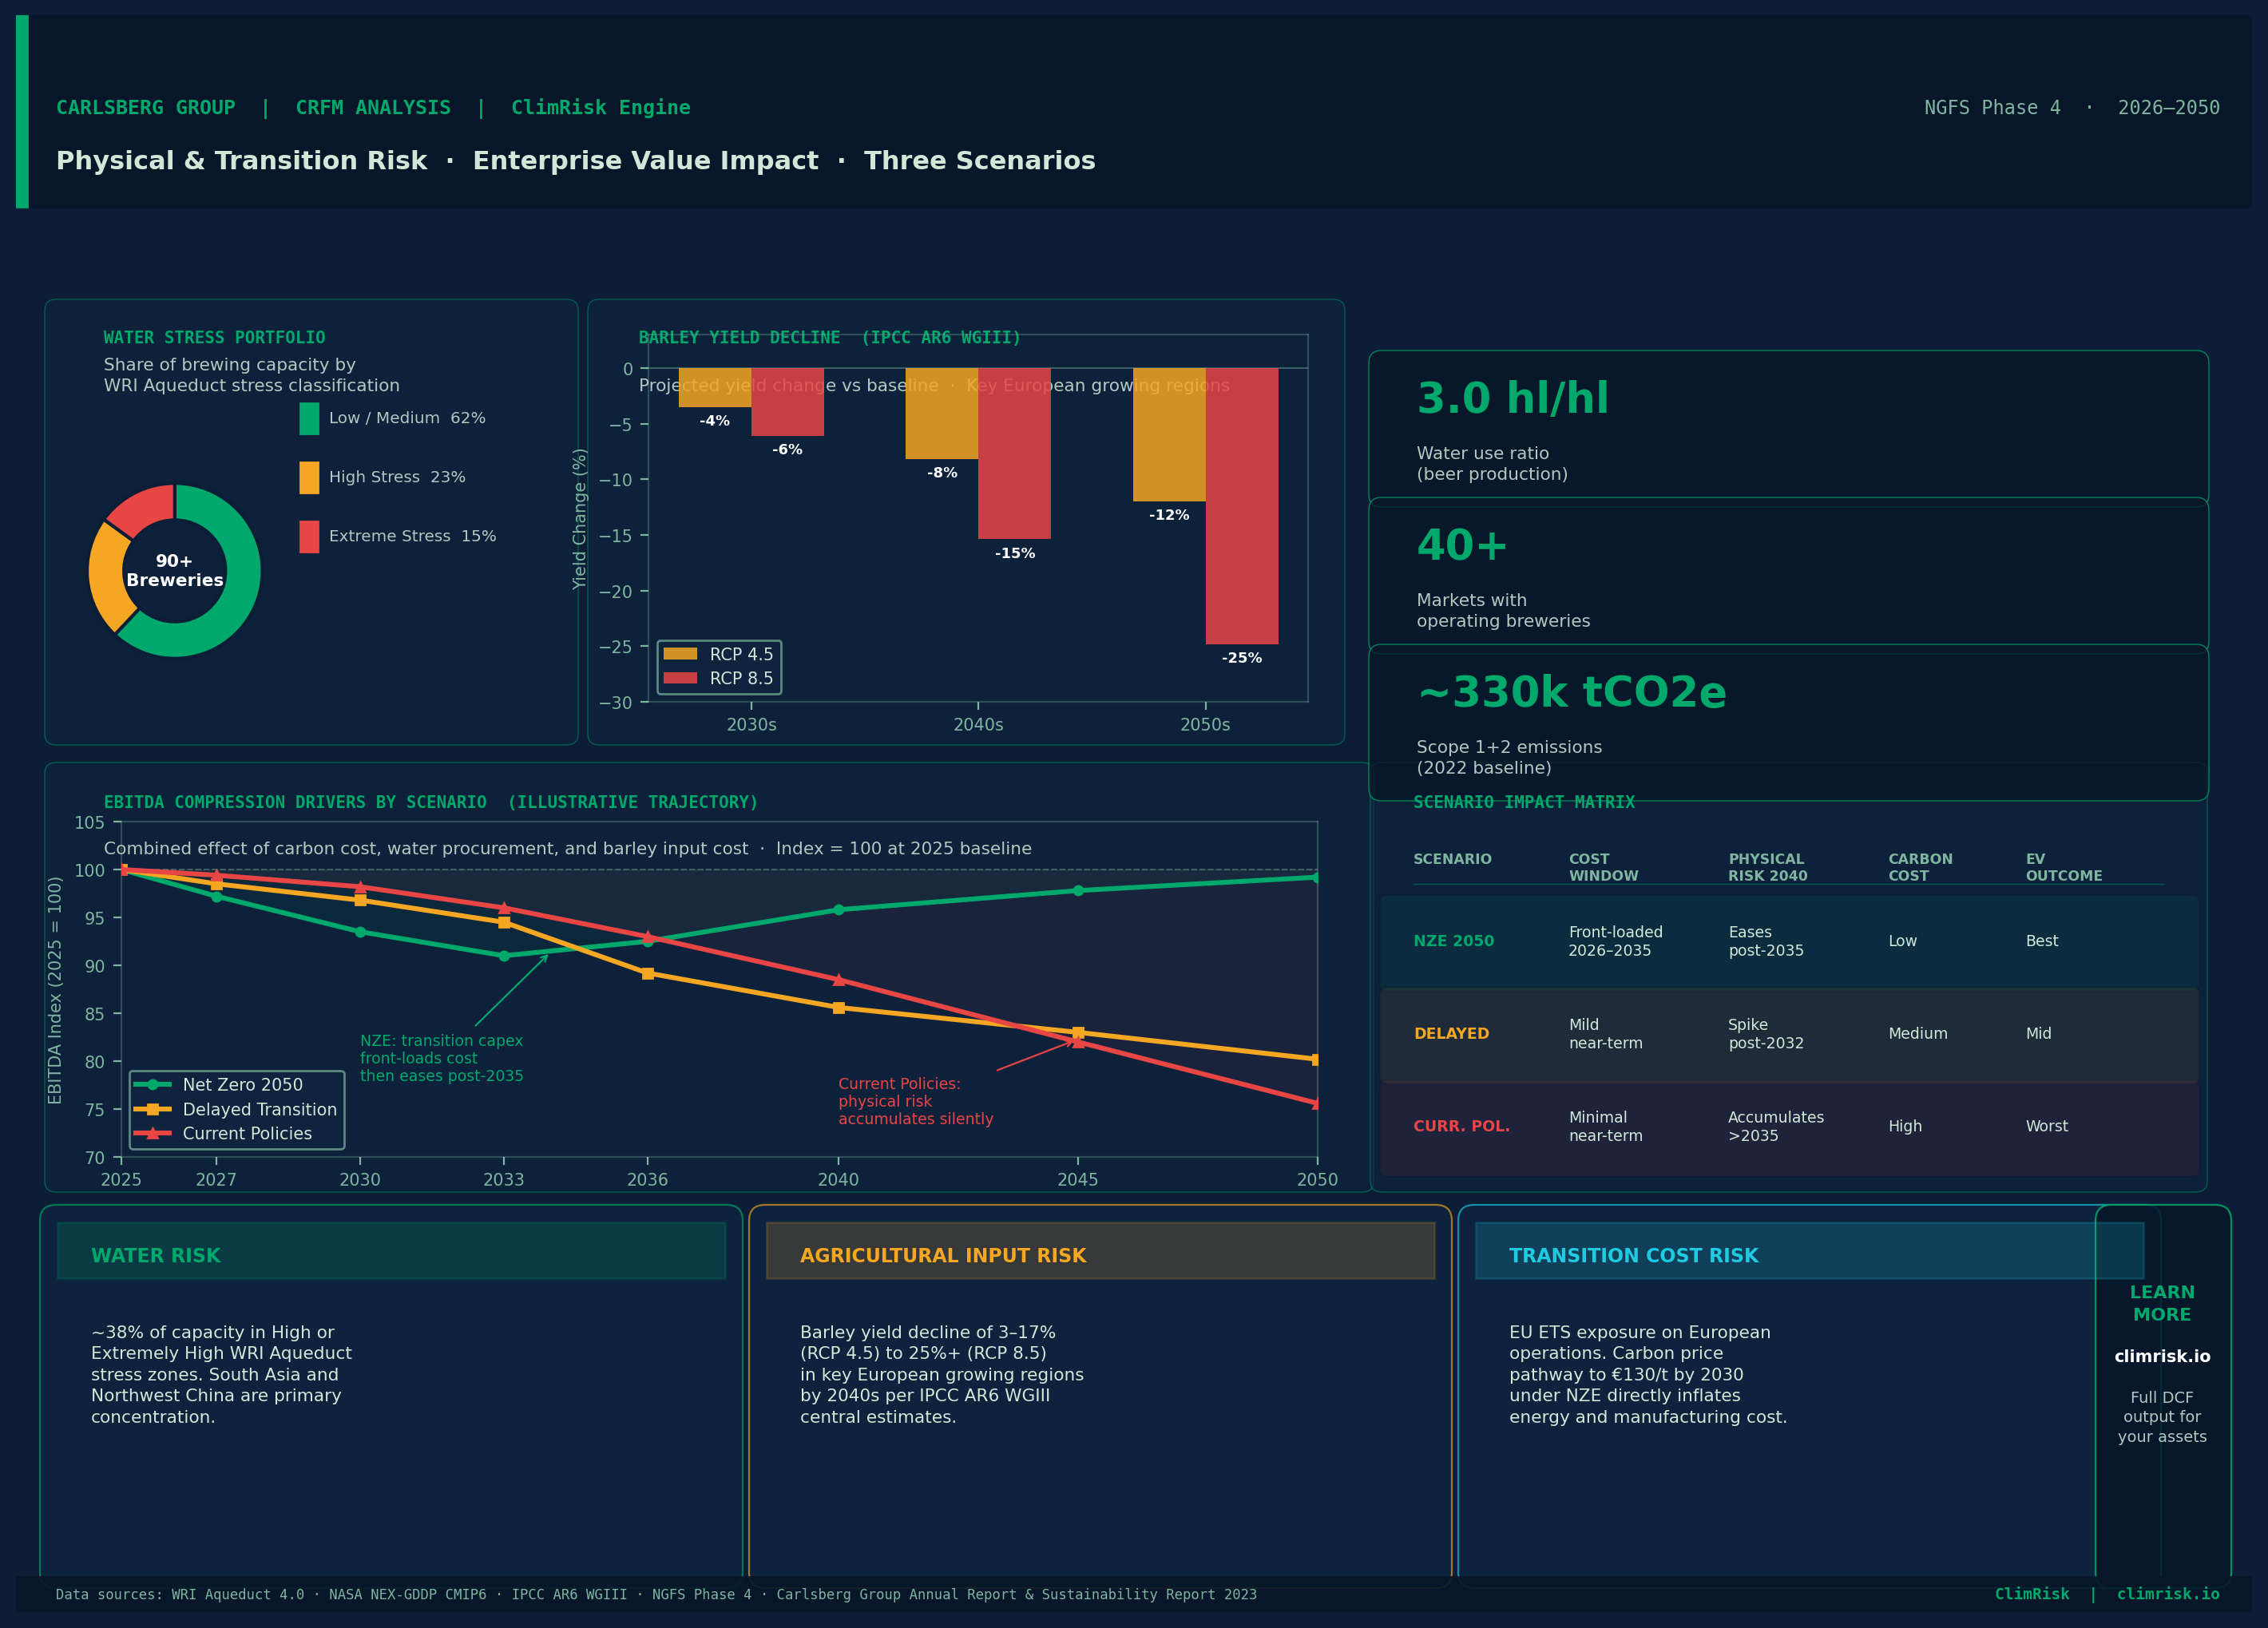
One — Agricultural input risk. Barley is the core raw material in beer production. Carlsberg sources barley from Western Europe, Eastern Europe, and increasingly from regions under active climate stress. Under RCP 4.5 scenarios (IPCC AR6 WGIII), barley yield reductions of 3 to 17% are projected across European growing regions by the 2040s. Under RCP 8.5, some key production zones in Southern Europe and Central Asia face reductions above 25%. These are not worst-case numbers. They are the IPCC central estimate range.
Two — Water scarcity at brewery sites. Brewing is water-intensive. Carlsberg's water use ratio as of 2023 stood at approximately 3.0 hectolitres of water per hectolitre of beer produced. That is genuinely efficient for the industry. But the question is not how much water Carlsberg uses per unit — it is how much water will be available at each site under future climate conditions. The WRI Aqueduct water risk atlas classifies several Carlsberg operating markets — including Rajasthan and Andhra Pradesh in India, parts of Northwest China, and North Africa — as currently facing High or Extremely High water stress. Under 2040 CMIP6 projections, those stress classifications deteriorate further.
Three — Transition cost on manufacturing and logistics. Carlsberg's European breweries in Denmark, Germany, France, the UK, and Switzerland operate under or adjacent to EU ETS carbon pricing. Energy costs in brewing are significant — heating, cooling, carbonation, packaging lines. A carbon price trajectory that reaches €130 per tonne by 2030 under Net Zero 2050 directly affects manufacturing cost structures for any operation that has not yet fully decarbonised its energy supply.
Physical Risk: Asset-Level Assessment
A CRFM physical risk assessment runs at the asset level, not at the company level. Company-level averages hide geography. What matters is where each brewery sits, what hazards face that specific location, and how those hazard intensities change by decade.
Running Carlsberg's publicly disclosed brewery footprint through a GIS-resolved hazard matrix using WRI Aqueduct and NASA NEX-GDDP projections produces a portfolio picture that looks roughly like this:
Water Stress Exposure
This is the primary physical hazard for Carlsberg. Approximately one-third of the company's reported brewing capacity sits in basins that WRI Aqueduct currently classifies as High or Extremely High water stress. Under NZE 2050 physical risk projections, the fraction of High-stress sites does not improve materially before 2035 — because committed warming from historical emissions drives water stress trajectories regardless of near-term policy. Under a Delayed Transition or Current Policies scenario, stress levels at several South Asian sites deteriorate to categories that historically correlate with forced production curtailments.
Water stress does not mean a brewery stops immediately. It means operational costs rise as water sourcing becomes more expensive, more regulated, or more contested with local communities. For sites in India and China, water extraction licence risk is already a real operational consideration. By 2035, several Carlsberg sites in those markets face meaningful probability of production constraint under high-stress scenarios.
Heat Stress Exposure
South Asian and Southeast Asian operations are the most exposed here. Heat stress in brewing affects cooling loads and working conditions. Brewery cooling is energy-intensive; rising ambient temperatures in markets like India, Vietnam, and parts of China directly inflate energy costs. Based on CMIP6 ensemble projections for those regions, average cooling-degree-days in key Indian states increase by 15 to 30% by 2040 under RCP 4.5. That is a structural cost uplift that gets baked into every unit of beer produced in those markets.
Flood and Precipitation Extremes
Several Carlsberg markets in South and Southeast Asia — Bangladesh, Vietnam, India — sit in river delta and low-elevation geographies. IPCC AR6 projects increased extreme precipitation events in South and Southeast Asia under all scenarios by the 2030s. Flooding at logistics hubs and distribution facilities is not currently modelled in most beverage sector risk reports. It should be. Supply disruption from flooding is typically short-duration but high-cost, and it recurs.
Transition Risk: Three NGFS Scenarios
The CRI engine runs transition risk under three NGFS Phase 4 canonical scenarios: Net Zero 2050, Delayed Transition, and Current Policies. Each generates a different carbon price path, energy cost trajectory, and commodity demand-shift curve. Here is what each scenario means for Carlsberg specifically.
Net Zero 2050
Carbon price reaches approximately €65 per tonne today and escalates to €130+ per tonne by 2030 under this scenario. For Carlsberg's European operations, this is the critical exposure. The EU ETS already covers direct emissions from large industrial installations, and energy providers pass through carbon costs in electricity pricing. A brewery that has not fully transitioned its thermal energy to renewable sources by 2030 faces an escalating carbon cost line that compresses EBITDA every year.
Carlsberg's net zero targets on Scope 1+2 by 2040 are genuinely ambitious. But ambition in 2025 does not eliminate cost between now and 2035. The transition itself has a cost. Boiler replacements, heat pump installations, green energy procurement premiums — these are capital and operating expenditure items. Under NZE 2050, these costs arrive fast. The reward is that carbon cost exposure drops toward zero by 2040 if the transition is completed. The financial risk is concentrated in the 2026 to 2035 window.
On the demand side, Net Zero 2050 involves consumer price inflation from carbon taxes on transport and energy, which affects real consumer disposable income. For a premium beer brand, this is a secondary effect — premium categories historically show resilience to moderate demand compression. It is not a primary financial risk for Carlsberg under this scenario.
Delayed Transition
Carbon price stays lower for longer — approximately €20 to €40 per tonne through 2030 — then spikes sharply in the 2030s as policy response accelerates. This scenario is arguably the highest financial risk scenario for a company planning capital allocation today, because the mild early-period pricing creates false comfort. Companies that under-invest in transition capex during the 2026 to 2032 window face a much steeper cost when carbon prices re-accelerate. The physical risk trajectory under Delayed Transition is also worse than NZE in absolute terms, because less early emissions reduction means more committed warming by mid-century.
For Carlsberg specifically, the Delayed Transition scenario is operationally tricky. The lower near-term carbon price weakens the business case for accelerated capex on brewing decarbonisation. But the physical risk from delayed policy action hits water stress and agricultural input costs harder in the 2035 to 2050 window.
Current Policies
Low and stable carbon prices through 2050. No acute transition cost. But the highest physical risk outcome — global mean temperature rises of 2.5 to 3°C by 2100 under this pathway, which means severe water stress deterioration, more frequent extreme weather, and barley yield reductions in the upper range of IPCC projections. For a company operationally dependent on water and barley, Current Policies is not the "safe" scenario. It is the scenario where physical risk accumulates without mitigation.
Financial Impact: What Goes Into the DCF
Running a climate-adjusted DCF on Carlsberg means modelling four adjustment terms per year per scenario:
The first is agricultural input cost uplift from barley yield decline and price volatility. The second is water procurement and efficiency capex at stressed sites. The third is carbon cost on Scope 1+2 emissions — either paid as carbon price or invested as abatement capex. The fourth is energy cost inflation from transition on the grid.
Under Net Zero 2050, the EBITDA compression from these four factors is front-loaded in the 2026 to 2035 decade, then eases as the energy transition matures and carbon costs fall for a decarbonised operation. Under Current Policies, EBITDA compression is back-loaded — relatively lower near-term costs but accelerating physical risk costs from 2035 onward as water stress worsens.
The enterprise value impact across scenarios reflects which of these trajectories the market prices. A company that completes its Scope 1+2 transition on schedule by 2040 and invests in water resilience at its Asian sites is in a structurally different financial position by 2045 than one that delays both.
Carlsberg's balance sheet as of FY2023 carries approximately €11 billion in enterprise value. The scenario spread on terminal value is not trivial. At the asset level, the difference between a well-resilience-invested water-stressed site and an unhedged one can represent meaningful production cost divergence by 2035.
What the Data Says About Carlsberg's Position Today
Carlsberg is better positioned than many beverage companies on the transition risk side. Their net zero targets are credible, their Scope 1+2 trajectory is declining, and their water use efficiency ratio has improved year over year. These are not vanity metrics. They translate directly into lower climate-adjusted WACC under a properly calibrated model.
The physical risk side is more nuanced. The geographical concentration of capacity in South and Southeast Asia — markets that are economically attractive but physically vulnerable — creates a portfolio-level concentration of water and heat stress exposure that Carlsberg's current disclosures acknowledge but do not fully quantify in financial terms.
The agricultural input risk is the least modelled and arguably the most material over a 15-year horizon. Barley price spikes in drought years already appear in Carlsberg's cost of goods sold in annual reports. What is not yet published is a forward financial impact assessment of how yield decline under IPCC scenarios affects input cost trajectories for 2030 to 2050.
What This Means for Investors
Carlsberg is a fundamentally sound business in a sector that consumes water, barley, and energy at scale in geographies that are physically vulnerable. That combination does not make it a bad investment. It makes it an investment where climate-adjusted valuation matters significantly more than the current consensus model typically incorporates.
An investor using a standard DCF without climate adjustments is not modelling the same company that will exist in 2035. The enterprise value trajectory under Net Zero 2050 looks different from the trajectory under Delayed Transition — and both look different from a model that ignores physical risk entirely.
The question is not whether Carlsberg can survive climate change. It almost certainly can, at its current scale. The question is what the true risk-adjusted return looks like when you price water scarcity at the asset level, barley price volatility under IPCC scenarios, and carbon cost trajectories under three NGFS pathways into the same model — and compare that across peer brewers globally.
That comparison does not currently exist in any publicly available institutional research. It should.
Introducing ClimRisk
At ClimRisk, we built the Climate Risk Intelligence (CRI) Engine specifically to automate this analysis.
The engine accepts a company's asset data, runs each asset through a GIS-resolved physical hazard matrix using WRI Aqueduct and NASA NEX-GDDP projections, runs transition risk under three NGFS scenarios with sector-specific carbon cost and commodity price curves, and produces a full climate-adjusted DCF with enterprise value and EBITDA impact per scenario per year.
The output is not a score. It is a financial model — the same structure an investment analyst or credit risk officer would build, automated and delivered in 48 hours.
We are currently onboarding institutional clients in the EU for full-portfolio assessments. If you manage capital in, lend to, or advise companies in sectors with material water, agricultural, or carbon cost exposure — and you want the actual numbers behind the narrative — I would like to speak with you.
Physical hazard projections in this article reference WRI Aqueduct 4.0 water risk atlas, NASA NEX-GDDP CMIP6 ensemble projections, and IPCC Sixth Assessment Report Working Group II Chapter 5 (Food, Fibre, and Other Ecosystem Products). Barley yield impact ranges reference IPCC AR6 WGIII Table 5.2 and Kahiluoto et al. (2019) Nature Plants. NGFS Phase 4 carbon price pathways are publicly available from the Network for Greening the Financial System. Carlsberg financial figures referenced are from the Carlsberg Group Annual Report 2023 and Sustainability Report 2023, both publicly available.
Shrinivash D Kannan Founder, ClimRisk Climate financial risk intelligence — built for the numbers era of disclosure.
ClimRisk translates physical and transition climate risk into asset-level financial exposure. To run your own assets or portfolio through the engine, write to shri@climrisk.io or book a demo.