Carbon Border Policy · EU–India Steel
The First Certificates: What EU CBAM Will Cost an Indian Steel Plant, and When
The EU's third CBAM certificate price came in at €82.32 this week, but only 2.5 percent of emissions are payable in 2026; ClimRisk's engine shows how the bill compounds for Indian steel plants as the share rises to 100 percent by 2034.
Shrinivash D Kannan · 7 October 2026 · 8 min read
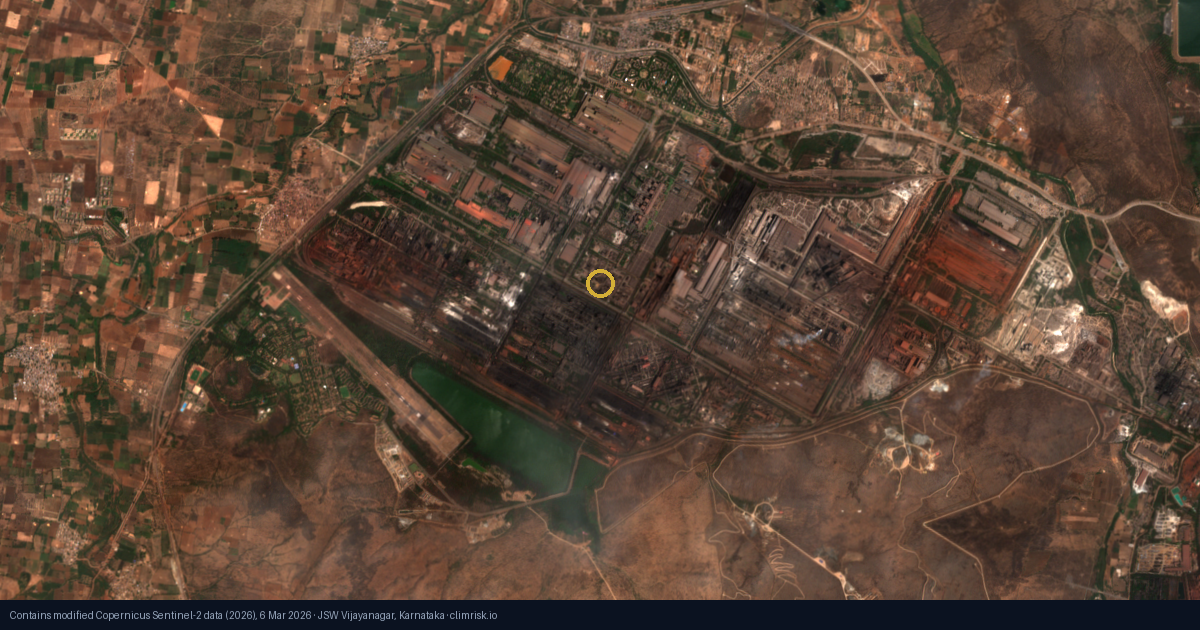
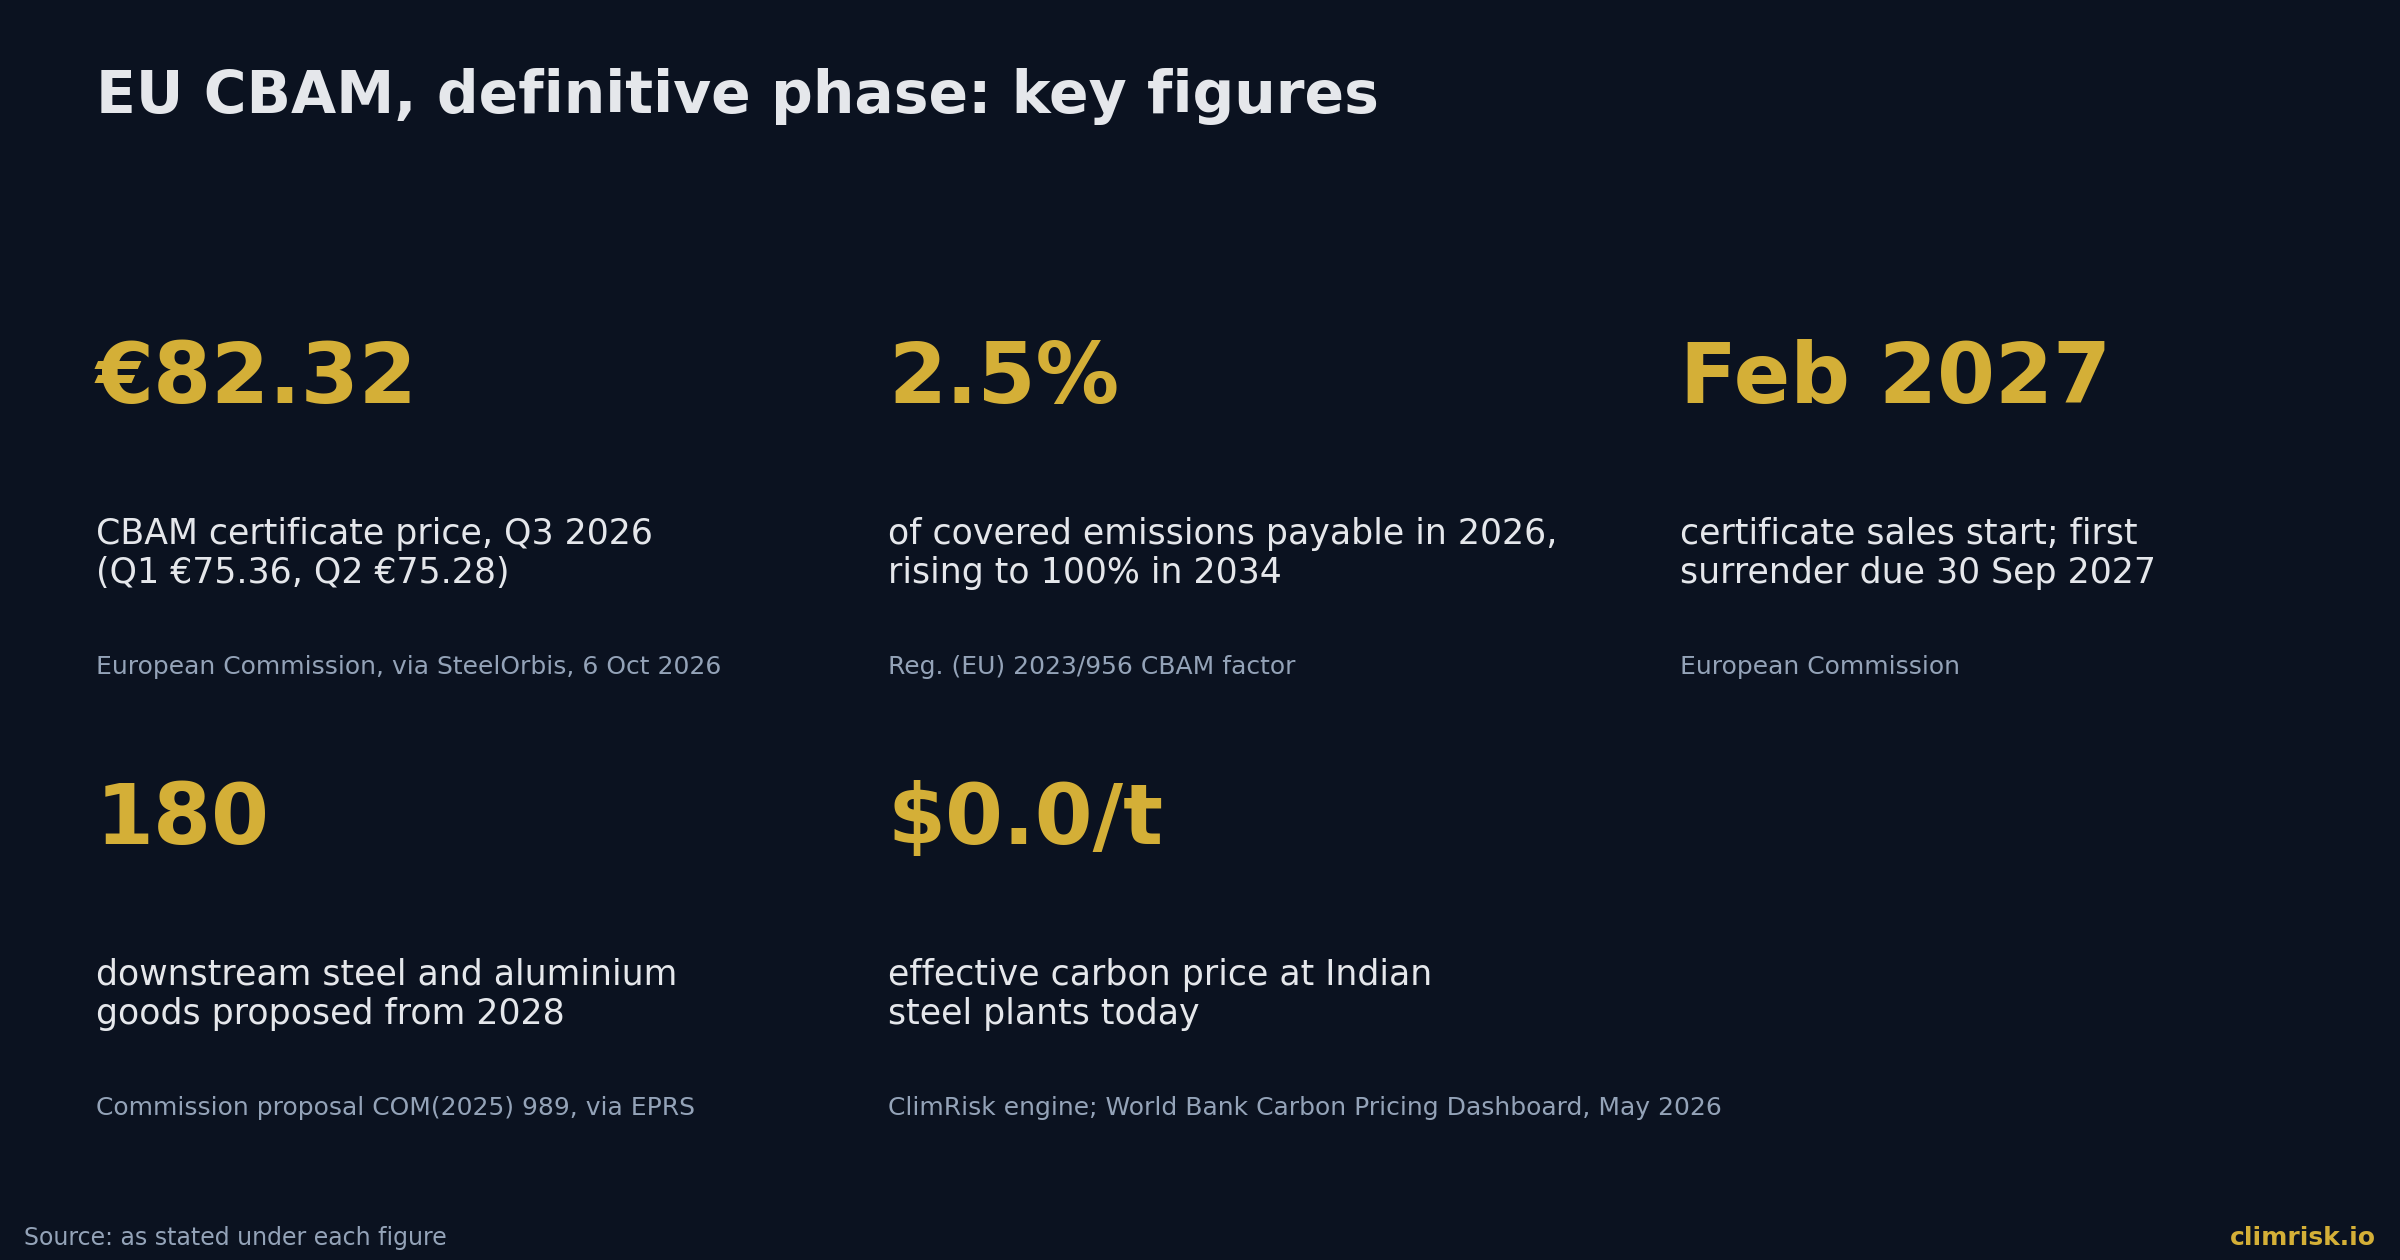
In the first week of October 2026 the European Commission published the third quarterly price for CBAM certificates: €82.32 a tonne of CO₂, up €7.04 (9.4 percent) on the second quarter's €75.28. [SteelOrbis 2026] The first quarter had come in at €75.36. [European Commission 2026]
Nobody has paid that price yet. The EU's carbon border adjustment mechanism, CBAM, entered its definitive phase on 1 January 2026, but importers cannot buy certificates until February 2027, and the first bill falls due on 30 September 2027. [European Commission 2026; Climease 2026] So 2026 is a year of accrual: every tonne of steel, cement, aluminium, fertiliser or hydrogen that enters the EU is already building a liability that will be settled later.
This piece looks at what that liability is, why it starts small, and why the small start can mislead. We ran three large Indian steel plants through the ClimRisk engine, because India is where the gap between the EU carbon price and the home price is widest. The plants belong to JSW Steel and its subsidiary, which our register lists with unusually complete data. We do not know how much of their output goes to Europe, and we do not claim they export to it. They are a worked example of a plant type, not an accusation.
How the price is set, and what it is not
CBAM is a certificate system with a price taken from the EU's own carbon market. For 2026 the Commission sets one price per quarter. It is "the weighted average of the auction clearing prices of the auctioned EU ETS allowances." [European Commission 2026] From 2027 the price becomes a weekly average. [European Commission 2026]
SOURCE — European Commission: "all CBAM certificates will be purchased on the common central platform from February 2027 onwards."
The price is therefore not a tax rate that a government chooses. It moves with the EU allowance auctions, which is why it rose 9.4 percent in a single quarter. An importer who budgets at €75 in April finds the reference at €82 by October.
The price is also only half of the bill. The other half is how many tonnes it applies to, and that is where 2026 is deceptive.
Why the first bill is small
CBAM exists so that imports do not escape the carbon cost that EU producers bear. EU producers in covered sectors still receive most of their allowances free, so importers are charged only for the share the EU producers actually pay for. In 2026 that share is 2.5 percent. [Reed Smith 2023; GreenSutra 2026]
The share then climbs by law: 5 percent in 2027, 10 percent in 2028, 22.5 percent in 2029, 48.5 percent in 2030, 61, 73.5 and 86 percent in 2031 to 2033, and 100 percent in 2034. [Reed Smith 2023]
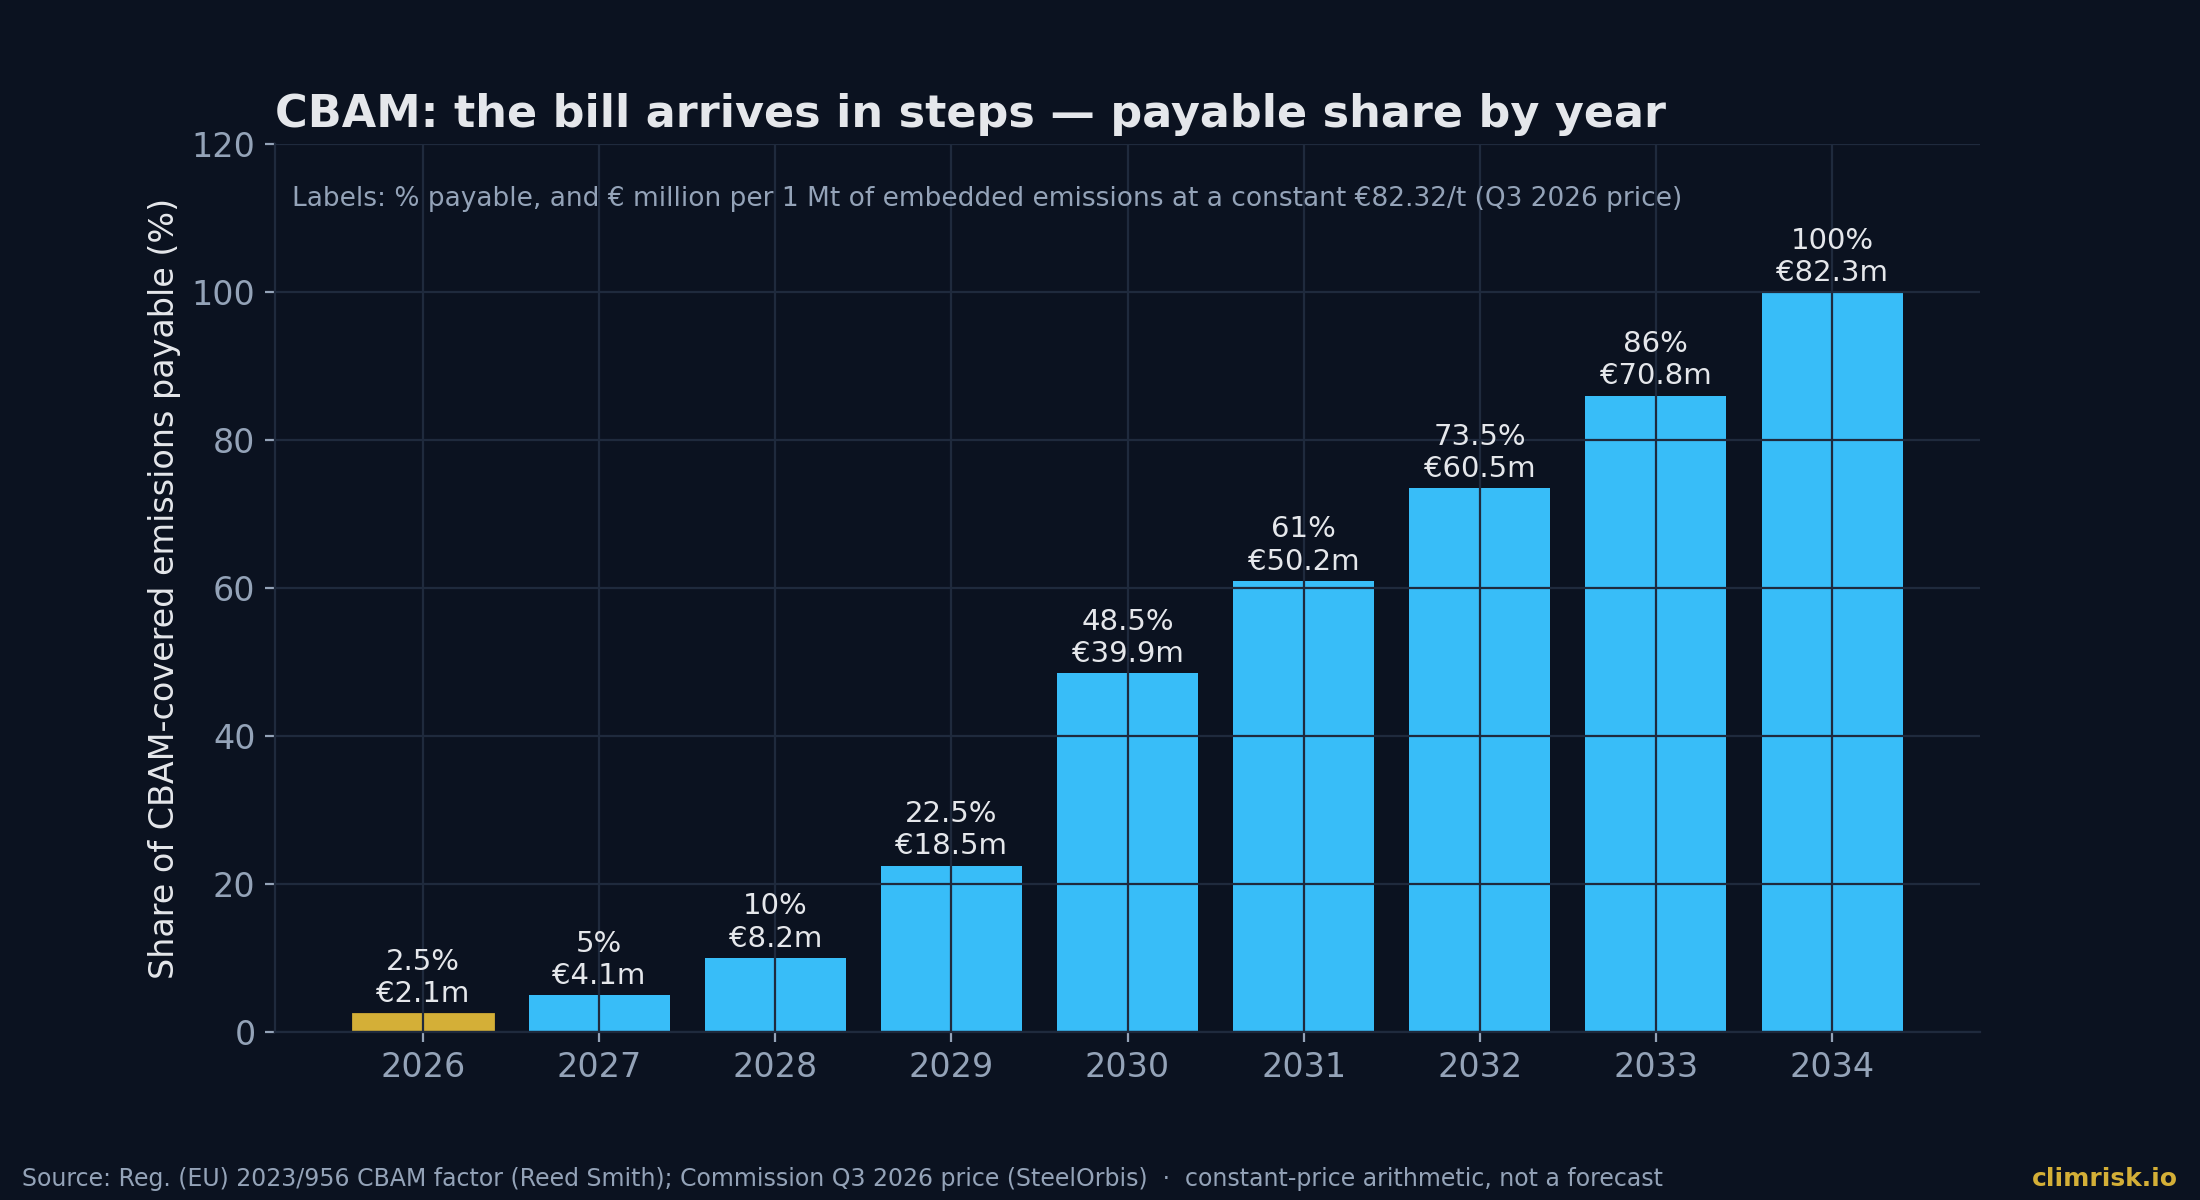
Take one million tonnes of CO₂ embedded in exports to the EU. At today's price, and ignoring any carbon price paid at home, the bill is about €2.1 million in 2026. In 2030 it is about €39.9 million. In 2034 it is €82.3 million. That is a 40-fold increase over eight years, with the price held flat. This is arithmetic on published numbers, not a forecast, and the real calculation deducts free allocation by product benchmark rather than as a simple share of emissions. The direction and the scale are what matter.
Two other features push the real cost above the headline.
The first is default values. An exporter who cannot supply verified emissions data is charged on a default intensity, plus a mark-up: 10 percent in 2026, 20 percent in 2027 and 30 percent from 2028. [GreenSutra 2026, citing Implementing Regulation (EU) 2025/2621] For Indian hot-rolled flat steel, one summary puts the base default at 4.28 tonnes of CO₂ per tonne of steel, rising to 4.71 in 2026 and 5.56 from 2028. [GreenSutra 2026] The mark-up is the price of not having measured.
The second is scope. The December 2025 Commission proposal would extend CBAM to 180 downstream products with a high steel or aluminium content, on average 79 percent, from 1 January 2028. [EPRS 2026; Mayer Brown 2025] It is still a proposal and has not been adopted. If it passes, a manufacturer that buys imported steel parts rather than steel itself will enter the system.
India: a large exposure and no home price to deduct
Exporters can deduct a carbon price paid in the country of origin. That deduction is what separates an exporter in a country with a carbon price from one without.
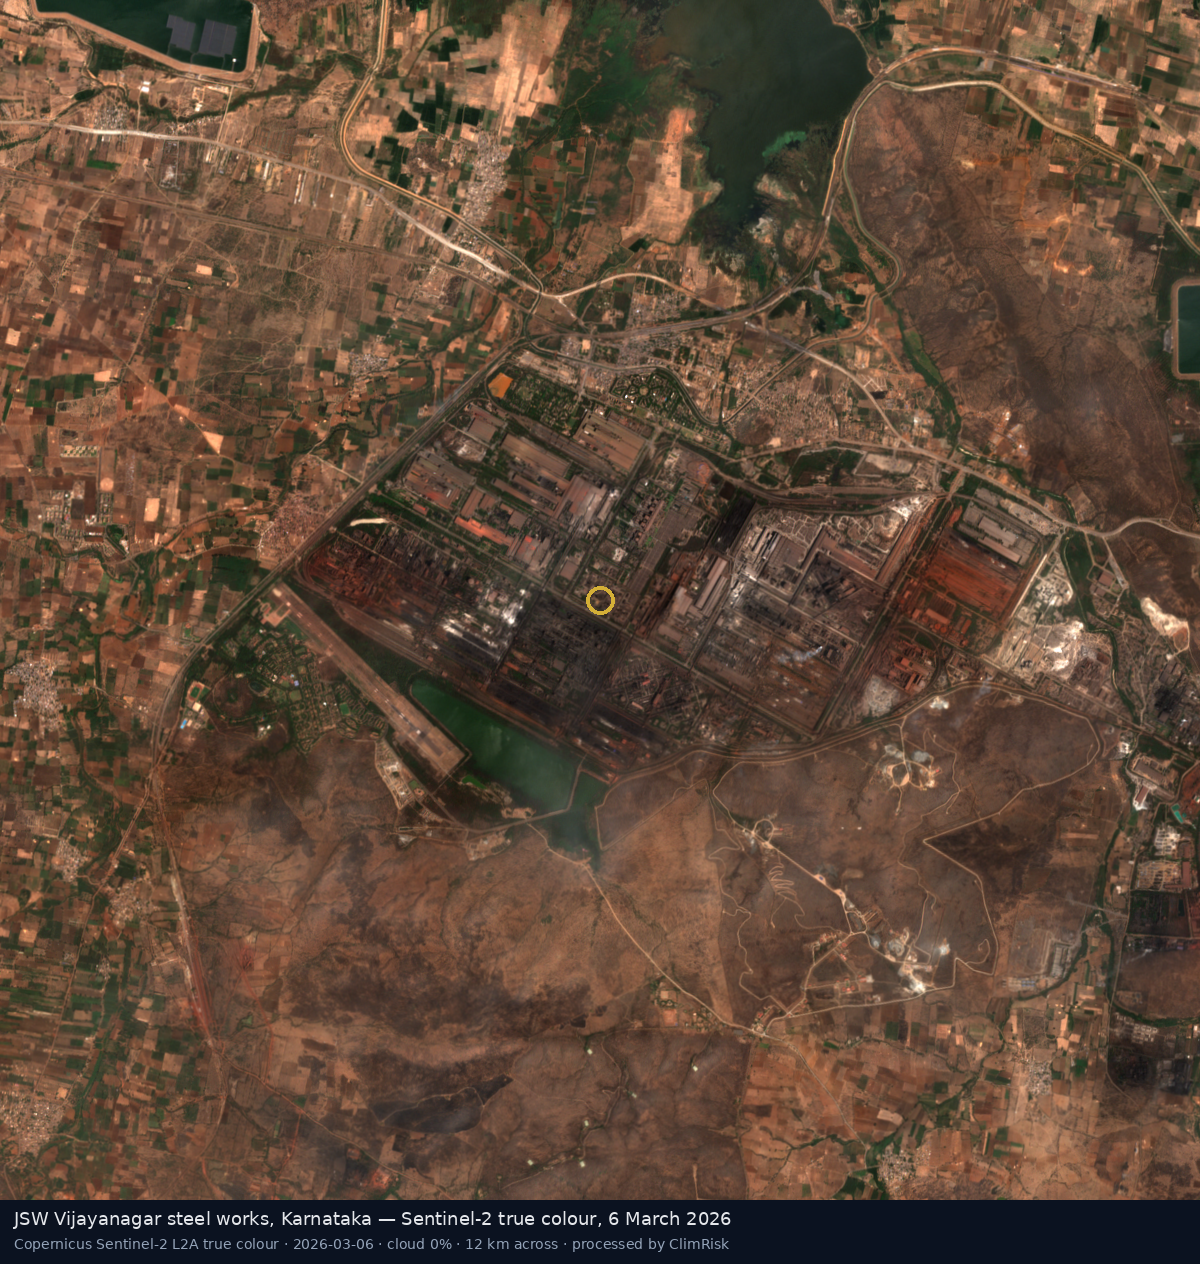
We ran the ClimRisk policy check on JSW's Vijayanagar steelworks in Karnataka. India's Carbon Credit Trading Scheme is listed as implemented, but the engine finds no effective carbon price at the plant today: USD 0.0 a tonne. [ClimRisk engine; World Bank 2026] The engine flags the product as in CBAM scope, so exports to the EU pay the EU carbon price less whatever has been paid at home. For now the deduction is close to zero.
The trade exposure is real. India exported roughly 4.3 million tonnes of CBAM-covered steel to the EU in 2024, according to Eurostat data cited by CBAMGuide, and CBAM-exposed steel exports fell 35 percent in the 2024–25 financial year, which the same source attributes to buyers anticipating the regime. [CBAMGuide 2026] We could not verify that attribution independently, so treat it as context rather than a finding.
What the engine says
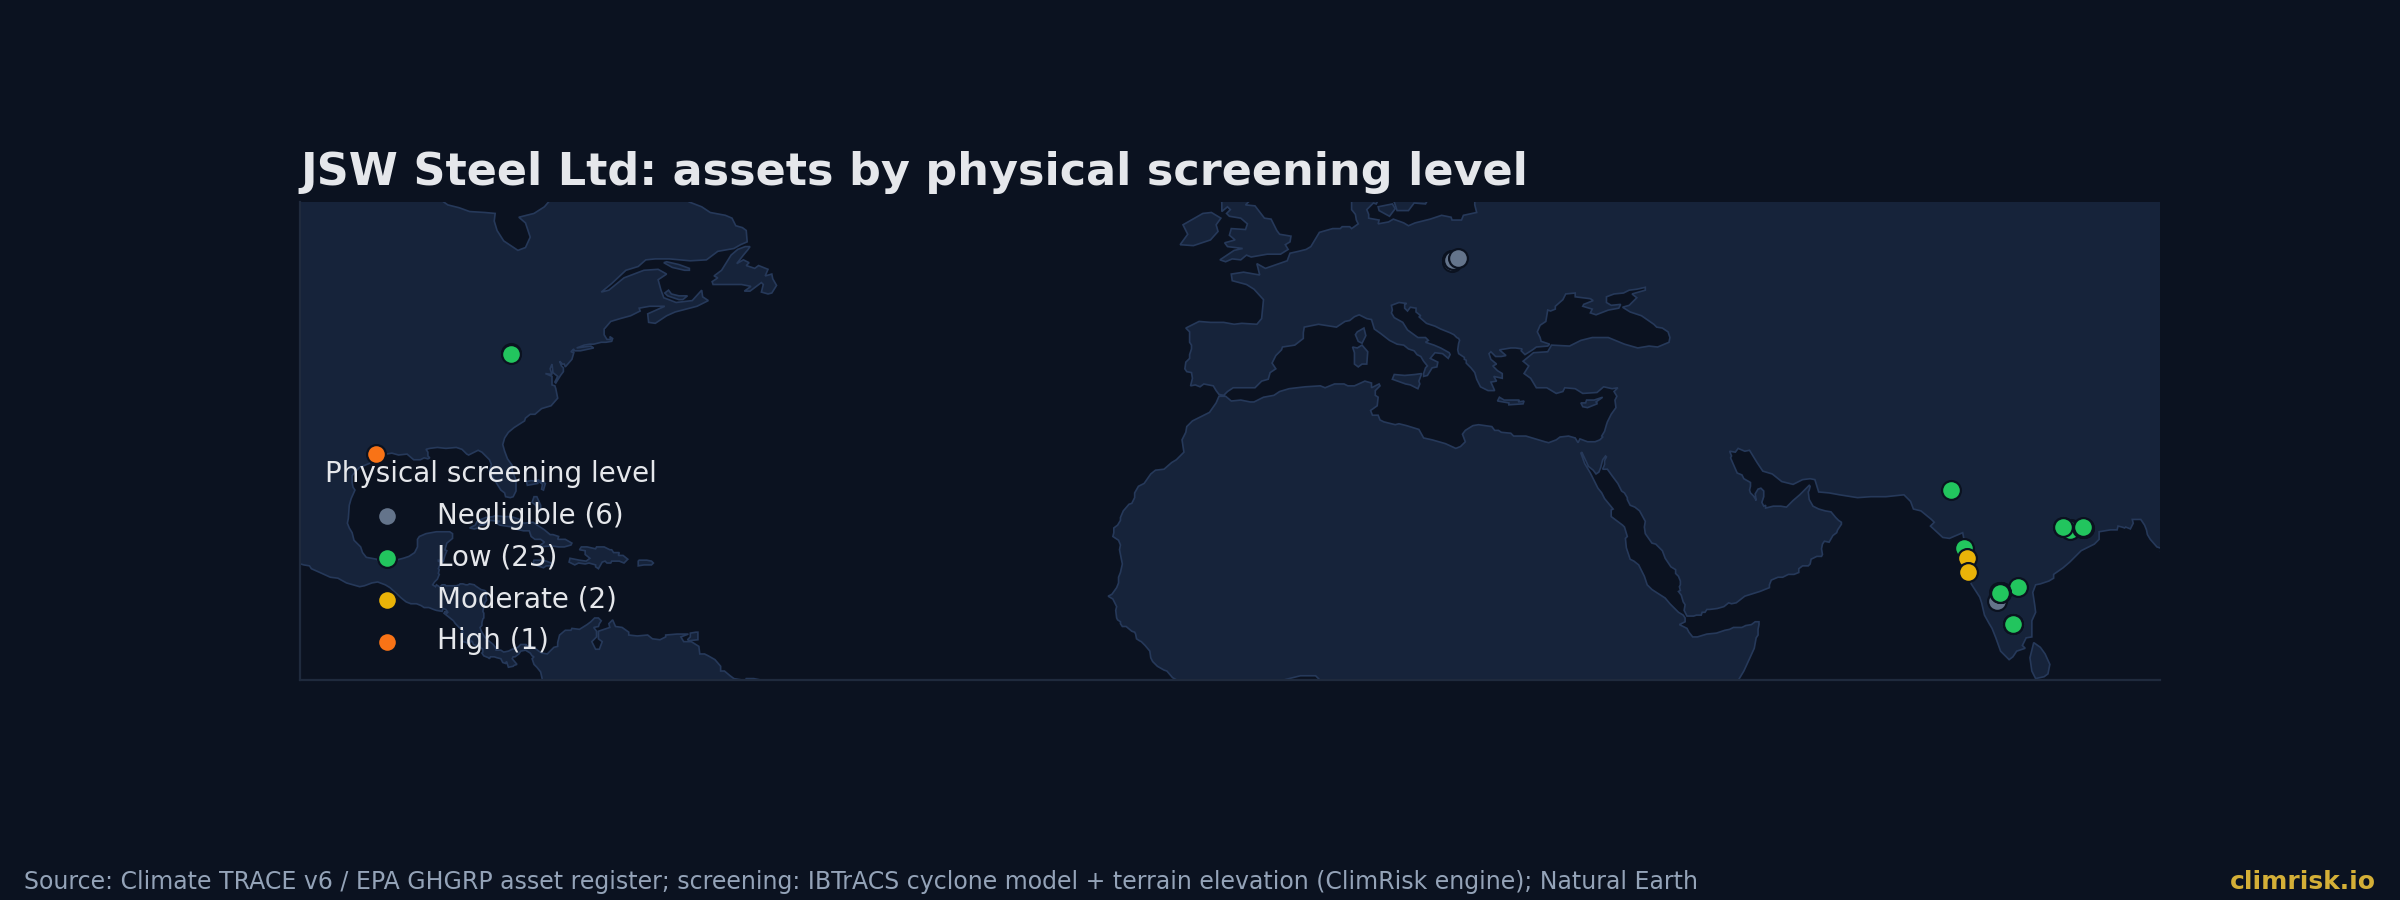
We ran three plants: JSW Vijayanagar (12.6 million tonnes of CO₂ a year), JSW Dolvi (13.6 million) and JSW BPSL Jharsuguda (8.4 million). [Climate TRACE v6 via ClimRisk register] Together they emit 34.7 million tonnes a year, on register benchmark values of USD 5.89 billion, USD 5.05 billion and USD 2.48 billion. The engine's value basis is the register benchmark, not company accounts.
Because the plants' EU export share is unknown, we ran two assumptions: 10 percent and 25 percent of output sold into the EU. These are sensitivities, not estimates of any company's sales. The engine charges the EU price, less the home price, on that share of emissions, using the CBAM phase-in above and NGFS Phase 5 carbon-price paths. It reports present values for 2026 to 2050 at a 7 percent discount rate, with emissions unabated.
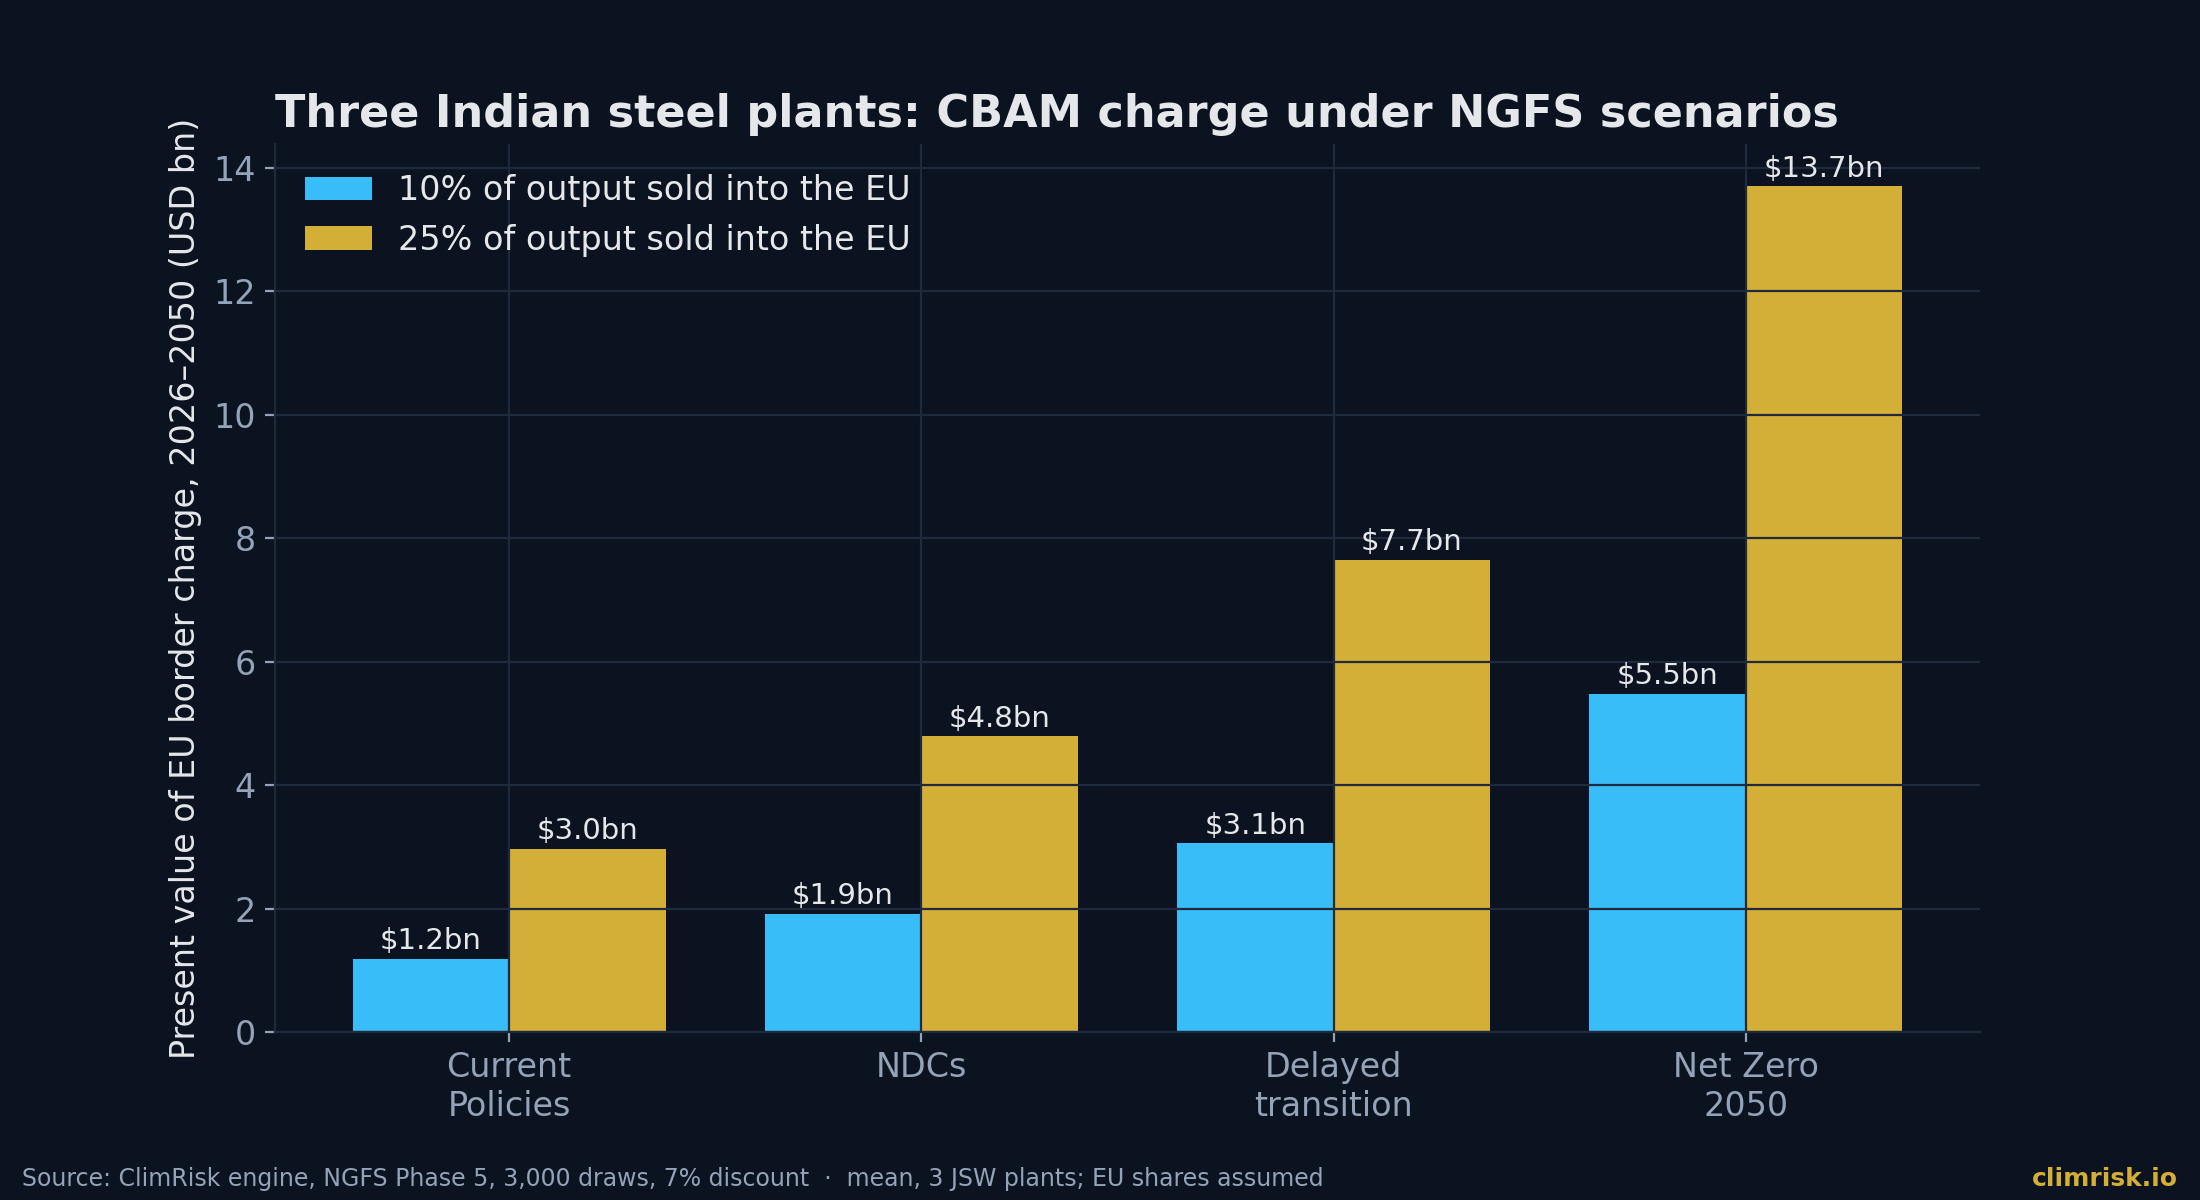
The pattern is clear. At a 10 percent EU share the three plants' combined border charge has a mean present value of USD 1.2 billion under Current Policies, USD 3.1 billion under Delayed Transition and USD 5.5 billion under Net Zero 2050. At 25 percent the same figures are USD 3.0 billion, USD 7.7 billion and USD 13.7 billion. For Vijayanagar alone at 10 percent, the median is USD 0.44 billion under Current Policies and USD 1.08 billion under Delayed Transition, with a 95th percentile of USD 2.4 billion in the latter.
Two things stand out.
Even the weakest scenario is not zero. Under Current Policies, India never prices carbon much at home (the engine's median is about USD 0.9 a tonne in 2026). The border charge is then almost entirely a transfer to Brussels. It is still a billion-dollar present value at 10 percent EU share, because the phase-in shown above does most of the work after 2030.
The scenarios that raise the home price do not cancel the border charge. Under Net Zero 2050, India's modelled carbon price starts near USD 58 a tonne in 2026 and passes USD 140 by 2030, so the deduction grows. The border charge is still the largest, because the EU path rises too. What changes is who collects. The plants' total carbon cost across all emissions, not just exported tonnes, is USD 44 billion in present value under Net Zero 2050, against USD 11.7 billion under Delayed Transition and USD 0.3 billion under Current Policies. CBAM is the smaller piece of a much larger repricing.
Physical risk is a footnote. Vijayanagar's modelled average annual damage is about USD 12,000. Dolvi, on the Konkan coast, shows moderate cyclone and coastal screening and is the one plant where weather matters. For these assets the carbon line is the one that moves value.
What investors, lenders and operators should do
Measure before the mark-up bites. The default-value mark-up rises each year. A plant that can supply verified emissions data per product avoids it. This is cheap compared with the liability.
Ask for the EU export share, by product. Most disclosures give group revenue, not tonnes sold into the EU. Our sensitivity shows the share moves the answer by a factor of 2.5. Lenders should request it in covenant reporting.
Model 2030, not 2026. A 2026 bill of 2.5 percent says little about a 2030 bill of 48.5 percent. Credit analysis that stops at the current year will understate the exposure.
Track the home carbon price. A carbon price paid at home is deductible. The policy debate over steel targets under the Carbon Credit Trading Scheme decides whether that money stays in India or goes to the EU.
Watch the downstream proposal. If the 180-product extension is adopted, the exposure spreads to manufacturers who never thought of themselves as steel importers.
Method and limitations
The payable-share logic follows the engine's CBAM module, which applies the phase-in to a share of emissions. The legal calculation deducts free allocation by product benchmark and may give a different figure for a given product. The EU export share is an assumption. Register emissions come from Climate TRACE and are modelled, not company-reported. Asset values are benchmarks. Carbon prices in NGFS are model shadow prices, and pass-through to customers is sampled by the engine. Several regulatory figures above come from law-firm and trade-press summaries of the Commission's texts, as cited. They should be checked against the Official Journal before use in a contract or filing. Q3 price publication is reported as 5 or 6 October depending on the outlet.
How ClimRisk measured this
We ran the ClimRisk Risk Analyst on three register assets: physical hazards with flood defences, carbon-pricing policies in force from the World Bank dashboard (May 2026 release), NGFS Phase 5 transition paths for India, and a 3,000-draw Monte Carlo of losses for 2026 to 2050 at a 7 percent real discount rate. We then re-ran each plant with an EU export share of 10 and 25 percent to switch on the CBAM module. All values are USD present values. Emissions are held unabated, and results are shown as means with medians and 95th percentiles where stated.
Sources
- European Commission — Price of CBAM certificates (Q1 €75.36, Q2 €75.28; method; sales from Feb 2027)
- SteelOrbis — EU CBAM certificate price rises to €82.32 for Q3 2026
- Climease — CBAM certificate price 2026: quarterly prices, purchase timing and 2027 changes
- Reed Smith — EU Carbon Border Adjustment Mechanism (phase-out schedule 2026–2034)
- GreenSutra — Why do importers pay only 2.5 per cent of CBAM emissions in 2026?
- GreenSutra — What is the CBAM mark-up on steel default values?
- European Parliamentary Research Service — CBAM downstream extension briefing (July 2026)
- Mayer Brown — Commission issues CBAM operational rules and proposes downstream extension (Dec 2025)
- CBAMGuide — India: CBAM exposure and steel exports
- World Bank Carbon Pricing Dashboard (May 2026 data release)
- Climate TRACE v6 (asset emissions)
- NGFS Phase 5 scenarios via IIASA
ClimRisk translates physical and transition climate risk into asset-level financial exposure. To run your own assets or portfolio through the engine, write to shri@climrisk.io or book a demo.