Physical Risk · South Asia · Agricultural Finance · August 2026
The Financial Anatomy of a Monsoon Deficit
What happens to global markets when India's rain fails — a deep dive into agricultural credit exposure under a shifting monsoon.
Shrinivash D Kannan · 13 August 2026 · 10 min read
A new El Niño is forming in the equatorial Pacific. NOAA's ENSO monitoring data shows sea surface temperatures in the Niño 3.4 region — the central Pacific benchmark that climate scientists watch most closely — are rising ahead of the pace recorded in other recent warming years. The trajectory points toward a significant event by late 2026 and into 2027.
For most financial markets, the word El Niño surfaces as a vague risk footnote. For anyone with exposure to global food supply chains, agricultural credit, emerging market sovereign debt, or South Asian infrastructure, it is something more specific. It is the physical mechanism that most directly determines whether India's monsoon fails.
That relationship — between Pacific ocean temperatures and Indian rainfall — is one of the most consequential and most financially under-priced connections in global commodity markets. This piece breaks it down from the physical parameters to the financial transmission, using data from the India Meteorological Department, FAO, IPCC AR6, the Reserve Bank of India, and the Network for Greening the Financial System.
What the Indian Summer Monsoon Actually Is
The Indian summer monsoon is not simply seasonal rainfall. It is the dominant moisture delivery system for the world's second most populous country and one of its largest agricultural economies.
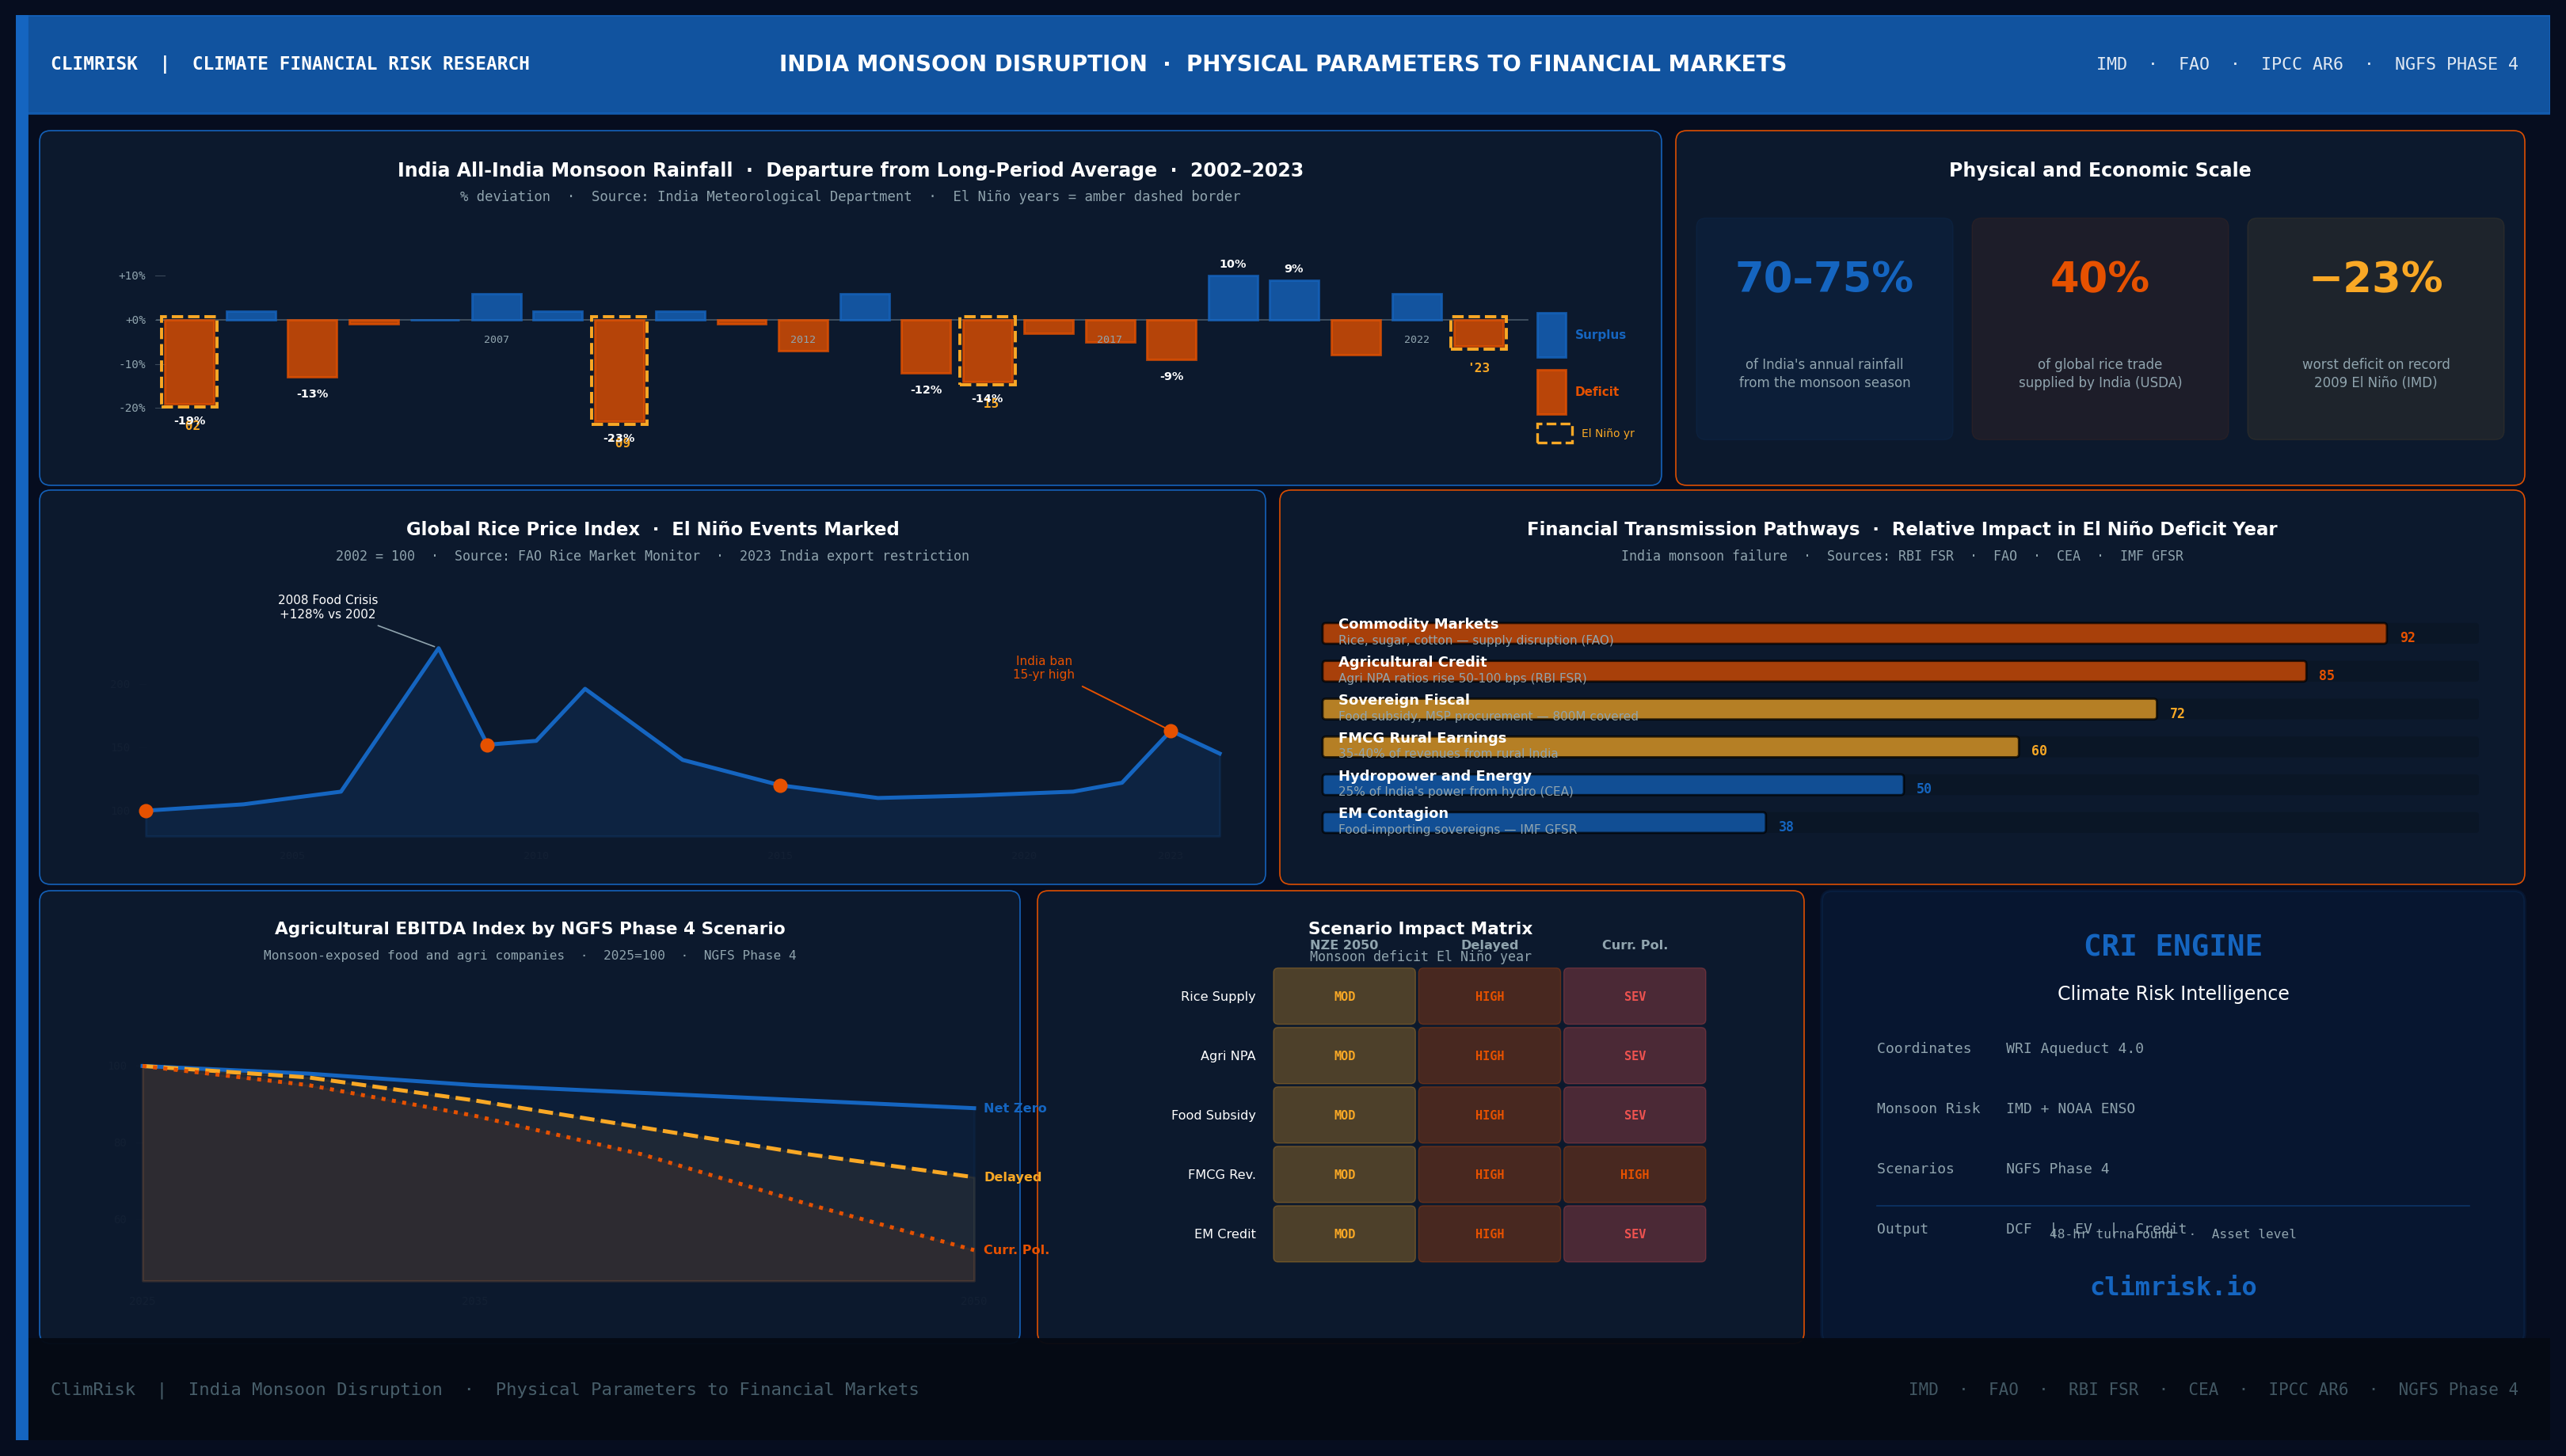
The India Meteorological Department, which has tracked monsoon rainfall since 1871 using a network of observatories across the subcontinent, defines the monsoon's long-period average as the mean all-India rainfall over the reference period 1971 to 2020. The southwest monsoon arrives over Kerala in early June, advances northward through July, and withdraws by late September. That four-month window delivers approximately 70 to 75 percent of India's total annual rainfall.
According to the Ministry of Statistics and Programme Implementation, agriculture accounts for approximately 15 percent of India's GDP — but it employs close to 50 percent of the workforce and underpins the rural consumption that drives demand for everything from motorcycles to packaged foods to fertiliser. When the monsoon underdelivers, the economic transmission is broad and deep.
The Physical Mechanism: Why El Niño Breaks the Monsoon
The Indian summer monsoon is driven by the temperature differential between the rapidly warming Asian landmass and the Indian Ocean. As the land heats faster than the sea, it pulls moisture-laden ocean air inland — creating the low-pressure system that generates rainfall across the subcontinent.
El Niño disrupts this mechanism through the Walker Circulation. IPCC AR6 Working Group I Chapter 3, which assesses ENSO and its global teleconnections across 150 years of observational data, identifies the Indian monsoon suppression as one of the most robust and historically consistent El Niño signals in the climate system. The report states that the weakening of the Walker Circulation — the large-scale atmospheric loop connecting the Pacific and Indian Oceans — shifts tropical convection eastward, reduces moisture transport into the Indian subcontinent, and suppresses the pressure gradient that drives monsoon rainfall inland.
The historical record from IMD confirms the physical relationship precisely. In 2002, a moderate El Niño produced a 19 percent all-India rainfall deficit against the long-period average. In 2009, a moderate event produced the most severe monsoon deficit in 27 years: all-India rainfall stood at 23 percent below the long-period average, affecting agriculture across 10 states and triggering the Indian government's drought declaration under the National Disaster Management framework. In 2015, the first season of the 2015 to 2016 Super El Niño produced a 14 percent deficit, affecting kharif crop output in Maharashtra, Karnataka, and Uttar Pradesh.
In each of these years, the same physical sequence played out: Niño 3.4 SST anomaly elevated, Walker Circulation weakened, Indian Ocean convection suppressed, monsoon onset delayed or rainfall reduced.
What a Deficit Year Actually Does: The 2023 Case
The 2023 to 2024 Super El Niño, which peaked at approximately +2.0°C above the 1991 to 2020 baseline in the Niño 3.4 region according to NOAA, provides the clearest recent case for the financial transmission.
India's 2023 southwest monsoon was spatially uneven and below normal in several major kharif producing states. The kharif season — running June through November — is when India grows the bulk of its rice, pulses, oilseeds, cotton, and sugarcane. A disrupted monsoon means disrupted kharif production.
The policy response came fast. In July 2023, India imposed restrictions on non-basmati white rice exports. The rationale was domestic food security: with rainfall deficits tracking across key growing states, the government moved to prevent export-driven price inflation from reaching the 800 million beneficiaries covered by India's National Food Security Act.
The FAO Rice Market Monitor reported that following India's export restrictions, global rice prices surged to their highest levels since 2008 — a 15-year high in a commodity that feeds more than 3 billion people. According to USDA Foreign Agricultural Service data, India supplies approximately 40 percent of global rice trade. When India partially exits the export market, the price signal is global and immediate.
This was not a policy decision made in isolation. It was a physical cascade: Pacific SST anomaly elevated, Walker Circulation weakened, Indian Ocean convection suppressed, monsoon rainfall reduced in key states, kharif output at risk, government imposed export restrictions, global rice price surged. Every step in that chain was driven by a physical mechanism.
The Six Financial Transmission Pathways
Agricultural commodity markets. Rice is the most visible transmission, but the 2023 monsoon disruption moved across the full kharif crop basket. India is the world's largest sugar producer according to FAO, and its production levels set a floor for global prices. Cotton from Gujarat and Maharashtra faces the same El Niño-linked vulnerability. A below-normal monsoon year compresses output across several globally traded commodities simultaneously, often within the same seasonal window.
Agricultural credit risk. India has the most extensive rural credit infrastructure of any emerging economy. The National Bank for Agriculture and Rural Development — NABARD — operates as the apex institution for agricultural finance, with a loan book spanning scheduled commercial banks, regional rural banks, cooperative credit societies, and microfinance institutions. The Reserve Bank of India's Financial Stability Reports have consistently documented the monsoon-NPA connection. In years of below-normal monsoon, gross non-performing asset ratios in the agriculture segment of scheduled commercial banks have historically risen above trend as farm income disruption flows through to loan repayment capacity. The RBI's June 2023 Financial Stability Report specifically flagged uneven monsoon distribution as an emerging risk for agricultural credit quality.
Sovereign and fiscal stress. India's National Food Security Act covers approximately 800 million beneficiaries who are entitled to subsidised grain through the public distribution system. When domestic production falls, the Food Corporation of India must either draw down buffer stocks or procure at higher minimum support prices. Both increase fiscal expenditure. In a major deficit year, food subsidy costs rise, fiscal deficit widens, and the sovereign's borrowing requirement expands. Rating agencies that cover Indian sovereign credit treat monsoon performance as a primary near-term fiscal variable.
Rural consumption and corporate earnings. India's FMCG sector — companies including Hindustan Unilever, ITC, Dabur, and Marico — consistently identifies rural demand as its largest volume driver. Rural consumption accounts for 35 to 40 percent of FMCG revenues in India depending on category, and agricultural income is the primary driver of rural purchasing power. In years when the monsoon delivers below-normal rainfall across multiple major agricultural states, rural wage income falls, farm household spending contracts, and FMCG volumes in rural markets drop within two quarters of the monsoon season. This connection is reported in quarterly earnings calls across the sector with remarkable consistency.
Hydropower and energy substitution. According to the Central Electricity Authority of India, the country generates approximately 25 percent of its electricity from hydropower. Monsoon rainfall is the input to hydropower reservoirs. A deficit year reduces reservoir levels, curtails hydropower generation, and forces the grid to substitute with thermal generation — primarily coal. This increases generation costs, tightens power supply in monsoon-dependent states, and increases India's thermal coal import requirement. A physical rainfall signal becomes an energy market signal within the same season.
Emerging market contagion. A significant monsoon disruption that moves global rice and sugar prices also affects other net food importing countries in South and Southeast Asia, Sub-Saharan Africa, and the Middle East — many of which carry dollar-denominated debt and face their own fiscal pressures when food import costs rise. The IMF's World Economic Outlook and Global Financial Stability Report have documented the connection between agricultural commodity price spikes and emerging market sovereign stress across multiple episodes. A monsoon-driven Indian rice export restriction reverberates through food-importing sovereign credit profiles from Bangladesh to Senegal.
What Climate Science Says About the Monsoon Through 2050
IPCC AR6 Working Group I Chapter 8, which assesses water cycle changes across all major warming scenarios, projects that the South Asian monsoon will become more variable and more intense in aggregate precipitation. The report's key finding, stated with high confidence, is that wet years will be wetter and dry years will be drier — and that the amplitude of these swings increases with baseline warming.
The El Niño relationship remains the dominant interannual driver of monsoon deficit years. What changes under continued warming is the baseline conditions on which each El Niño event operates. IPCC AR6 Chapter 8 states that as the Indian Ocean and the global land surface warm, the magnitude of physical disruption from a given El Niño SST anomaly increases. The same Niño 3.4 anomaly that produced the 14 percent monsoon deficit in 2015 operates on a warmer ocean and a warmer atmosphere in 2035 and 2045, with more evaporation stress during dry phases amplifying the production impact of a given rainfall deficit.
The NGFS Phase 4 scenarios describe what this means for capital allocation. Under Net Zero 2050, warming stabilises and the El Niño amplification of monsoon disruption is contained near current levels. Under Delayed Transition, committed warming through mid-century means each El Niño event from the 2030s onward produces systematically worse agricultural outcomes than the 2023 to 2024 event did. Under Current Policies, the compounding effect means a moderate El Niño in 2045 may produce monsoon disruptions that exceed anything in the 150-year IMD instrumental record — not because the physical mechanism changes, but because the baseline on which it operates has shifted by 2.5 to 3°C above pre-industrial.
The financial implication is arithmetic: the same physical event becomes financially larger each decade the warming baseline rises.
What This Means for Capital Allocation
Standard financial models do not price monsoon risk systematically. India equity research treats the monsoon as a one-line qualitative comment in FMCG and agricultural sector notes rather than a quantified variable in earnings models. Agricultural credit risk frameworks in Indian and international banks do not embed ENSO cycle probability distributions into NPA forecasting. Sovereign credit models do not systematically connect monsoon deficit probability to fiscal stress estimates under different warming pathways.
The 2023 case shows this gap in real terms. The physical cascade from Niño 3.4 SST anomaly to India rice export restriction to global rice price spike — to its 15-year high — was physically predictable months before the export restriction was announced. The Walker Circulation signal was visible in atmospheric data by April 2023. IMD's June 2023 forecast flagged the risk of uneven spatial distribution. The financial consequences arrived in July. Markets priced them as a surprise. They were not.
What is required is the analytical framework that connects the physical signal to the financial output — at the asset level, at the sector level, and at the sovereign level — before the cascade completes rather than after.
Introducing ClimRisk
At ClimRisk, we built the Climate Risk Intelligence engine to provide exactly this connection.
The CRI engine maps asset and supply chain footprints against physical hazard projections — WRI Aqueduct 4.0, NASA NEX-GDDP CMIP6, and ENSO cycle data from NOAA — and translates physical risk into financial terms: EBITDA compression, enterprise value impact, credit loss probability, across three NGFS scenarios through 2050. For India-exposed portfolios, this means monsoon deficit probability and its sector-specific financial consequences are built into the model as a quantified variable, not a qualitative footnote.
The output is a financial model. Not a climate report, not a risk score with no financial output, not a narrative with no numbers. A DCF with physical climate adjustment terms.
If you manage capital with exposure to Indian agriculture, South Asian agricultural credit, global food commodity supply chains, or emerging market sovereign debt, and want to see what physically-grounded monsoon risk quantification looks like in practice, I would like to speak with you.
Physical and meteorological data: India Meteorological Department Long Period Average series and seasonal monsoon reports. ENSO monitoring: NOAA ENSO Monitoring Centre. Agricultural commodity and trade data: FAO Rice Market Monitor, FAO Sugar and Sweeteners Market Assessment, USDA Foreign Agricultural Service production and trade estimates. India macroeconomic and fiscal data: Ministry of Statistics and Programme Implementation, Ministry of Agriculture and Farmers Welfare, Food Corporation of India. Agricultural credit and financial stability: Reserve Bank of India Financial Stability Reports (2022, 2023), NABARD Annual Reports. Energy generation: Central Electricity Authority of India annual reports. Climate projections: IPCC AR6 Working Group I Chapter 3 (ENSO teleconnections) and Chapter 8 (water cycle changes). Transition scenarios: NGFS Phase 4 scenarios, publicly available from the Network for Greening the Financial System.
Shrinivash D Kannan Founder, ClimRisk Climate financial risk intelligence — built for the numbers era of disclosure.
ClimRisk translates physical and transition climate risk into asset-level financial exposure. To run your own assets or portfolio through the engine, write to shri@climrisk.io or book a demo.