Macro Risk
The Financial Anatomy of a Super El Niño
What the physical parameters of a super El Niño tell investors — before the headlines catch up.
Shrinivash D Kannan · 13 August 2026 · 9 min read
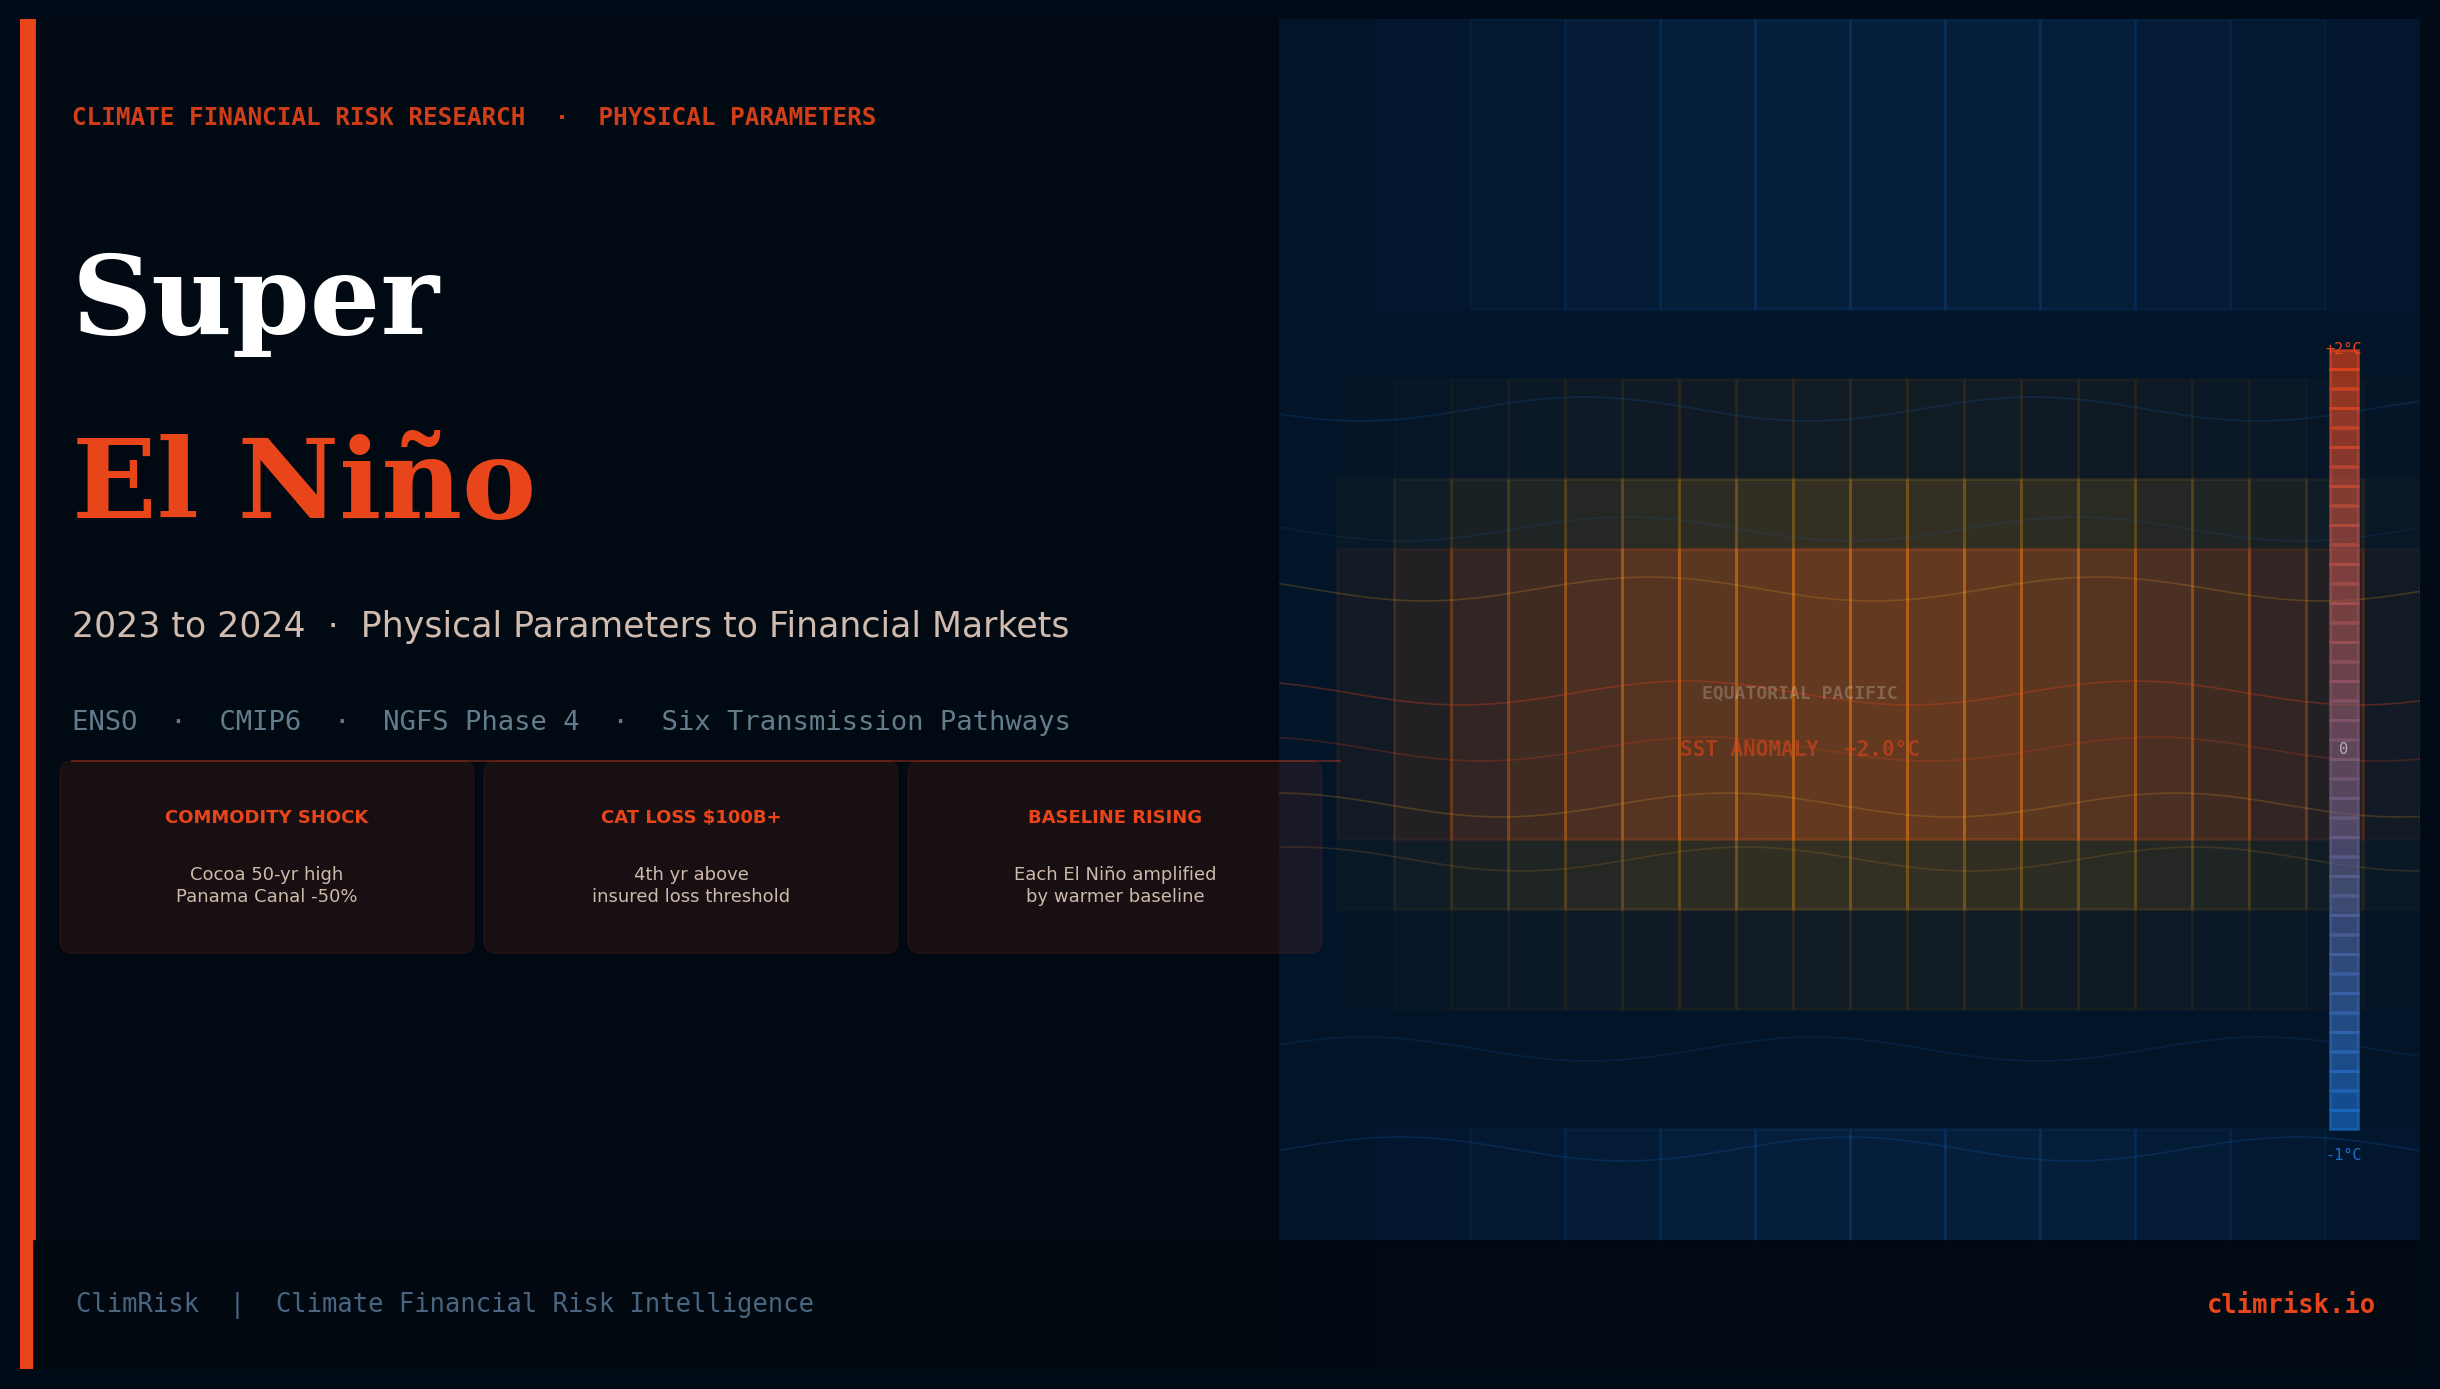
In 2023 the equatorial Pacific warmed by more than 2 degrees Celsius above its long-run average.
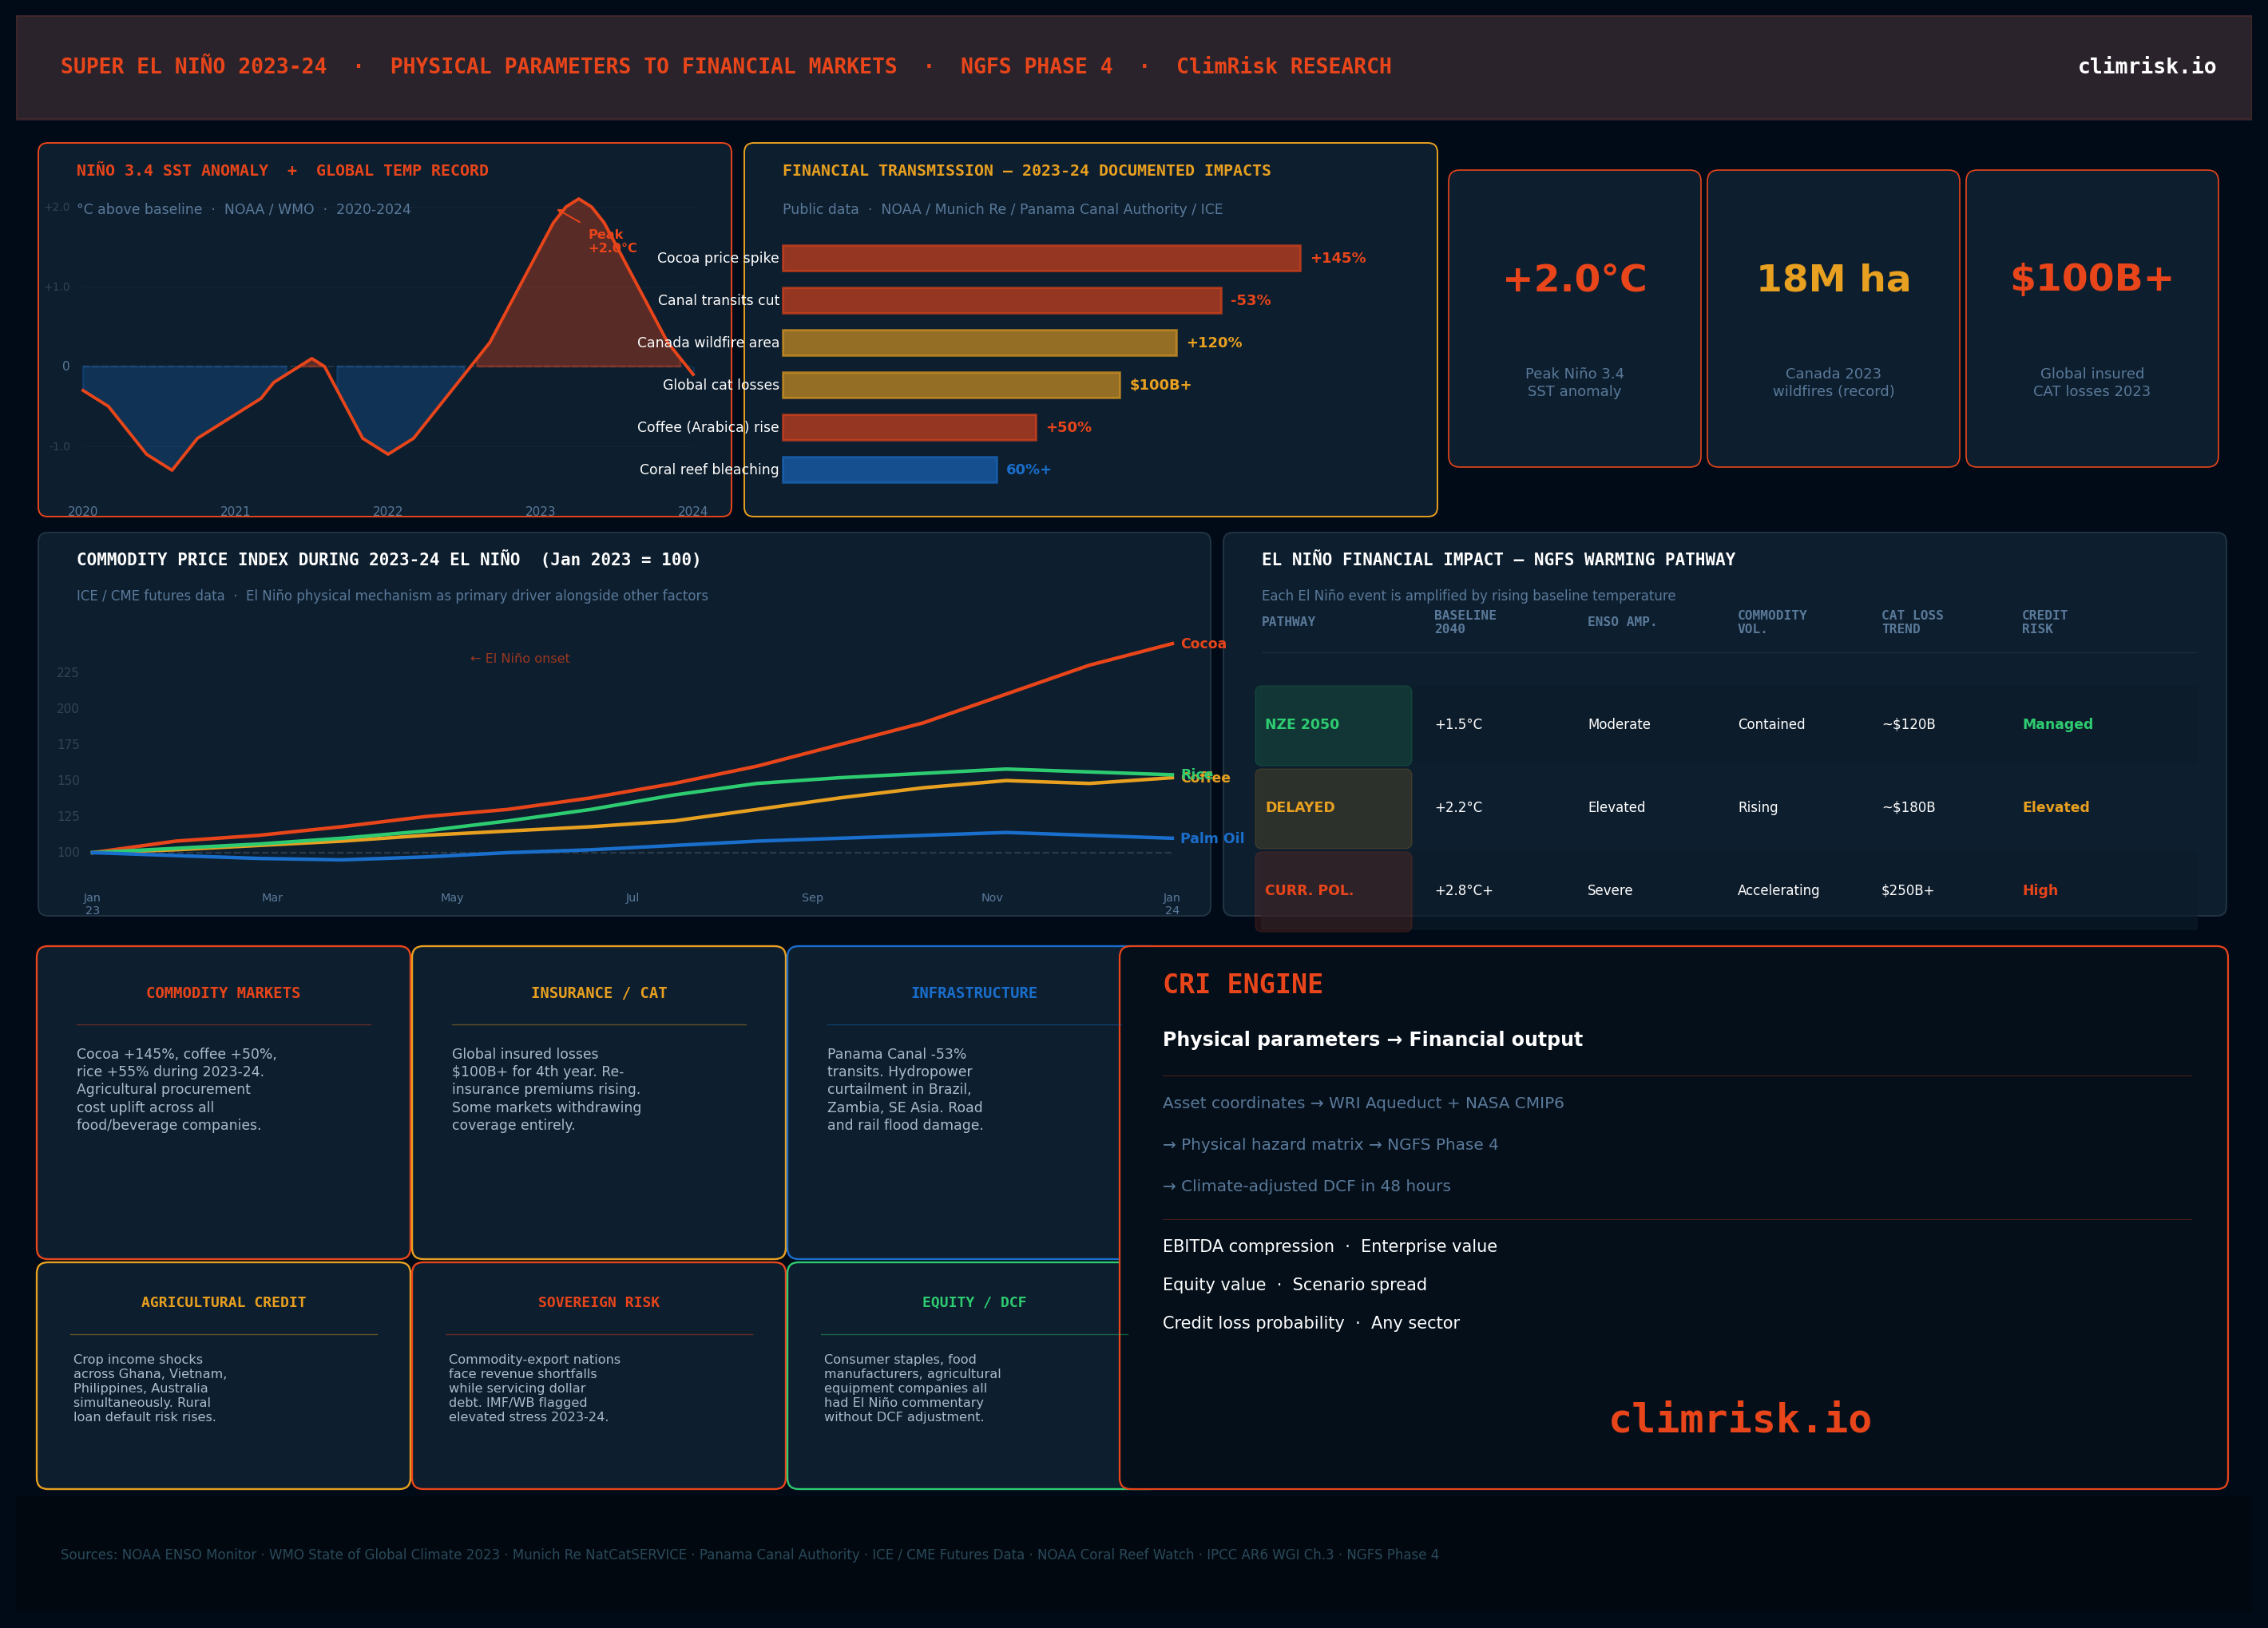
That single physical measurement — sea surface temperature anomaly — drove cocoa to a 50-year price high, cut Panama Canal transits by nearly half, burned 18 million hectares of Canadian forest, and pushed global insured catastrophe losses past $100 billion for the fourth consecutive year.
Most investors saw the price moves. Almost none traced them back to the atmospheric physics that caused them.
This piece does that. It breaks down the physical parameters of the 2023 to 2024 Super El Niño, maps the financial transmission mechanisms sector by sector, and explains what the climate science says about frequency and severity through 2050.
What Makes This One a Super El Niño
El Niño events are defined by sea surface temperature anomalies in the central and eastern equatorial Pacific — the Niño 3.4 region. A standard El Niño crosses the +0.5°C threshold. A strong event reaches +1.5°C. According to NOAA's ENSO monitoring data, the 2023 to 2024 event peaked above +2.0°C above the 1991 to 2020 baseline in November 2023, putting it in the category of the five strongest events since reliable instrumental records began.
Three physical measurements define what happened.
Sea surface temperature anomaly. The Niño 3.4 index peaked at approximately +2.0°C above the 1991 to 2020 baseline in November 2023, according to NOAA. This places it in the same range as the 1997 to 1998 event — the previous benchmark for a Super El Niño — and the 2015 to 2016 event. The key difference in 2023 to 2024 is the baseline. The underlying ocean is already warmer than in 1997. The anomaly sits on top of a structurally elevated global ocean temperature that has itself risen by approximately 0.9°C since pre-industrial levels.
Global mean surface temperature. According to the World Meteorological Organisation's State of Global Climate 2023 report, 2023 was the warmest year in the 174-year instrumental record, reaching approximately 1.45°C above the pre-industrial baseline. The El Niño signal amplified an already-elevated global temperature trend. Every month from June 2023 to January 2024 set a new monthly temperature record.
Walker Circulation disruption. The physical mechanism connecting Pacific ocean warming to global weather disruption is the weakening of the Walker Circulation — the large-scale atmospheric loop driven by the temperature gradient between the warm western Pacific and cooler eastern Pacific. When that gradient collapses in an El Niño, the entire tropical atmospheric circulation shifts. The ITCZ moves. Monsoon onset patterns change. The jet stream is deflected. These are not local events. They are global atmospheric reorganisations. IPCC AR6 Working Group I Chapter 3 identifies Walker Circulation weakening as the primary teleconnection mechanism linking Niño 3.4 SST anomalies to precipitation pattern shifts across Asia, the Americas, and Africa.
Physical Parameter Breakdown: What Happened Where
Southeast Asia and Australia — drought.
The Walker Circulation shift during El Niño suppresses rainfall across the western Pacific and Southeast Asia. In 2023 to 2024 this meant severe drought in the cocoa-growing regions of West Africa (Ghana, Ivory Coast), the coffee belt of Vietnam and Brazil, the rice-producing regions of Thailand and the Philippines, and the eastern agricultural belt of Australia.
Ivory Coast and Ghana together produce approximately 60% of global cocoa, according to the International Cocoa Organization. Both faced below-average rainfall during critical growing periods in 2023. ICE Futures Europe exchange records show cocoa arrived at the London terminal market in March 2024 at above £10,000 per tonne — the highest nominal price in over 50 years. This was not speculative. It was physically caused.
South America — flooding and infrastructure disruption.
The eastern side of the El Niño response is opposite: excess precipitation across Peru, Ecuador, northern Chile, and southern Brazil. Peru and Ecuador experienced severe flooding events in early 2024, damaging agricultural land and infrastructure. The anomalous warming in the Pacific off South America also contributed to the atmospheric moisture loading that drove flooding events across vulnerable coastal and river basin communities.
North America — wildfires and heat.
According to the Canadian Interagency Forest Fire Centre's 2023 season report, Canada experienced its largest wildfire season on record. Approximately 18 million hectares burned — more than double any previous record in Canadian history. The smoke blanketed major US cities and briefly gave Toronto and New York the highest air pollution readings on the planet. The insurance exposure from Canadian wildfires in 2023 contributed to a broader catastrophe loss year that, according to Munich Re NatCatSERVICE estimates, exceeded $100 billion in global insured losses.
Oceans — record heat and mass coral bleaching.
Global ocean surface temperatures in 2023 and early 2024 broke records by unprecedented margins. The North Atlantic in particular ran at anomalies of +1 to +1.5°C above previous records, contributing to intensified Atlantic hurricane conditions. In April 2024, NOAA Coral Reef Watch declared the fourth global mass coral bleaching event on record, with more than 60% of the world's coral reef area under bleaching-level thermal stress. This matters financially because coral reef-dependent fisheries, tourism, and coastal protection services are valued in the hundreds of billions of dollars annually, according to World Bank natural capital assessments.
Panama Canal — the infrastructure chokepoint.
The Panama Canal connects the Atlantic and Pacific and handles approximately 5% of global seaborne trade — including 46% of container traffic between Asia and the US East Coast. The canal depends on Gatun Lake, a freshwater reservoir that feeds the lock system. Panama Canal Authority operational bulletins from late 2023 show that El Niño-induced drought drove Gatun Lake to its lowest level in decades, prompting the Authority to reduce maximum daily transits from the normal range of 36 to 38 down to 18 — a reduction of more than 50%. Ships were required to reduce cargo loads or wait weeks for passage. Global shipping companies including Maersk and MSC began rerouting vessels around Cape Horn.
The Financial Transmission: How Physical Parameters Move Markets
The physical parameters do not stay in meteorology. They move through six financial transmission pathways.
Commodity markets. Agricultural commodities are the most direct transmission. Cocoa, coffee, rice, sugar, and palm oil all experienced significant price volatility in 2023 to 2024 driven directly by production disruptions. ICE and CME exchange records show Arabica coffee futures rose approximately 50% between mid-2023 and early 2024. According to the FAO Rice Market Monitor, rice prices hit multi-year highs after India — which accounts for approximately 40% of global rice exports according to USDA data — imposed export restrictions in response to domestic supply concerns linked to monsoon disruption. Every food and beverage company, every agricultural lender, and every commodity trader was exposed.
Insurance and reinsurance repricing. According to Munich Re NatCatSERVICE, global insured catastrophe losses exceeded $100 billion in 2023. This was the fourth consecutive year above $100 billion, a threshold that was breached for the first time in 2017. Reinsurance premiums rose sharply across property catastrophe lines in 2024. Several major reinsurers announced withdrawal or significant repricing in high-risk coastal and wildfire-exposed markets. The secondary insurance market is effectively beginning to price physical climate risk through the actuarial mechanism rather than the ESG mechanism.
Infrastructure impairment. The Panama Canal restriction is the clearest case in 2023 to 2024 but not the only one. Hydropower generation in Brazil, Zambia, and parts of Southeast Asia was curtailed by low reservoir levels. Road and rail infrastructure in flood-affected zones incurred damage costs. Airports in smoke-affected regions in North America experienced operational disruption. Each of these is an asset impairment with financial statement consequences.
Food and agriculture credit risk. Agricultural lenders — rural banks, development finance institutions, agricultural credit cooperatives — face increased default probability when crop yields decline sharply. The 2023 to 2024 El Niño created exactly those conditions across multiple geographies simultaneously. Ghana's cocoa farmers, Vietnamese coffee growers, Philippine rice farmers, and Australian grain producers all faced income shocks within the same 12-month window.
Emerging market sovereign risk. Commodity-dependent economies face fiscal stress when export revenues fall sharply. Countries like Ghana, Ecuador, the Philippines, and Zambia — all of which experienced significant El Niño disruptions — were simultaneously servicing dollar-denominated debt while facing export revenue shortfalls. Both the IMF World Economic Outlook and the World Bank Commodity Markets Outlook flagged increased debt service stress in commodity-exporting emerging economies in 2023 to 2024.
Equity valuation. Consumer staples companies with concentrated commodity procurement, food and beverage manufacturers with limited supply chain diversification, agricultural equipment companies, and specialty chemical companies dependent on biological inputs all had earnings calls in 2023 and 2024 where El Niño appeared in management commentary but not in the risk-weighted DCF.
What Climate Science Says About El Niño Frequency Through 2050
The relationship between anthropogenic warming and El Niño frequency and intensity is one of the more actively debated questions in climate science. The current understanding from IPCC AR6 Working Group I Chapter 3 and Chapter 11, which cover ENSO teleconnections and extreme events respectively, is as follows.
El Niño events are not projected to become more frequent under climate change. The ENSO cycle itself does not systematically accelerate. What changes is the baseline temperature on which each event sits. Because the underlying ocean and atmosphere are warmer, each El Niño event — even a moderate one — produces more extreme physical outcomes than the same event would have 30 years ago. The 2023 to 2024 event's record-breaking temperatures were partly the event itself and partly the warm baseline amplifying the event signal.
What IPCC AR6 does project with high confidence is that the intensity of extreme precipitation events associated with El Niño will increase. Wet regions get wetter, dry regions get drier, and the amplitude of the physical impacts grows with baseline warming.
The NGFS Phase 4 scenarios are explicit about this mechanism, as set out in the Network for Greening the Financial System's Phase 4 scenario documentation. Under Net Zero 2050, warming stabilises and the El Niño amplification effect is contained. Under Delayed Transition, committed warming by mid-century means each El Niño event produces systematically worse physical outcomes than today. Under Current Policies, the amplification compounds decade by decade — the 2040s equivalent of a Super El Niño produces outcomes well outside the historical range.
The financial implication is not that El Niño events become more frequent. It is that each one becomes financially larger.
What This Means for Capital Allocation
The 2023 to 2024 Super El Niño is not a tail event that can be modelled away. It is a demonstration run of the physical mechanism that will drive financial losses across commodity markets, insurance markets, infrastructure, and credit in every El Niño cycle from now to 2050 — with each cycle amplified relative to the previous one by the rising baseline.
Standard financial models do not capture this. Commodity price models do not incorporate El Niño probability-weighted production scenarios. Infrastructure valuations do not price hydrological stress on canal and reservoir systems. Agricultural credit models do not embed ENSO cycle risk. Sovereign credit models do not systematically account for commodity export revenue exposure to ENSO.
The physical parameters are public. The atmospheric physics is understood. The financial transmission mechanisms are observable in the historical record. What is missing is the systematic analytical framework that connects the physical to the financial.
Introducing ClimRisk
At ClimRisk, we built the Climate Risk Intelligence engine to provide exactly this connection.
The CRI engine maps asset and supply chain footprints against physical hazard projections — WRI Aqueduct, NASA NEX-GDDP CMIP6, NOAA ENSO cycle data — and translates physical risk into financial terms: EBITDA compression, enterprise value impact, credit loss probability, across three NGFS scenarios through 2050.
The output is a financial model. Not a climate report, not a risk score with no financial output, not a narrative with no numbers. A DCF with physical climate adjustment terms.
If you manage capital in commodity-exposed sectors, agricultural credit, infrastructure, or emerging market debt and want to see what physically-grounded climate risk quantification actually looks like, I would like to speak with you.
Shrinivash D Kannan Founder, ClimRisk Climate financial risk intelligence — built for the numbers era of disclosure.
ClimRisk translates physical and transition climate risk into asset-level financial exposure. To run your own assets or portfolio through the engine, write to shri@climrisk.io or book a demo.