Physical & Transition Risk · Japan · September 2026
The Loud Risk and the Quiet One: Typhoon Dujuan, the Super El Niño and Japan's Power Coast
Typhoon Dujuan broke Tokyo's rainfall records. For the power plants that ring Tokyo Bay, our engine finds the bigger financial exposure is not the storm.
Shrinivash D Kannan · 30 September 2026 · 7 min read
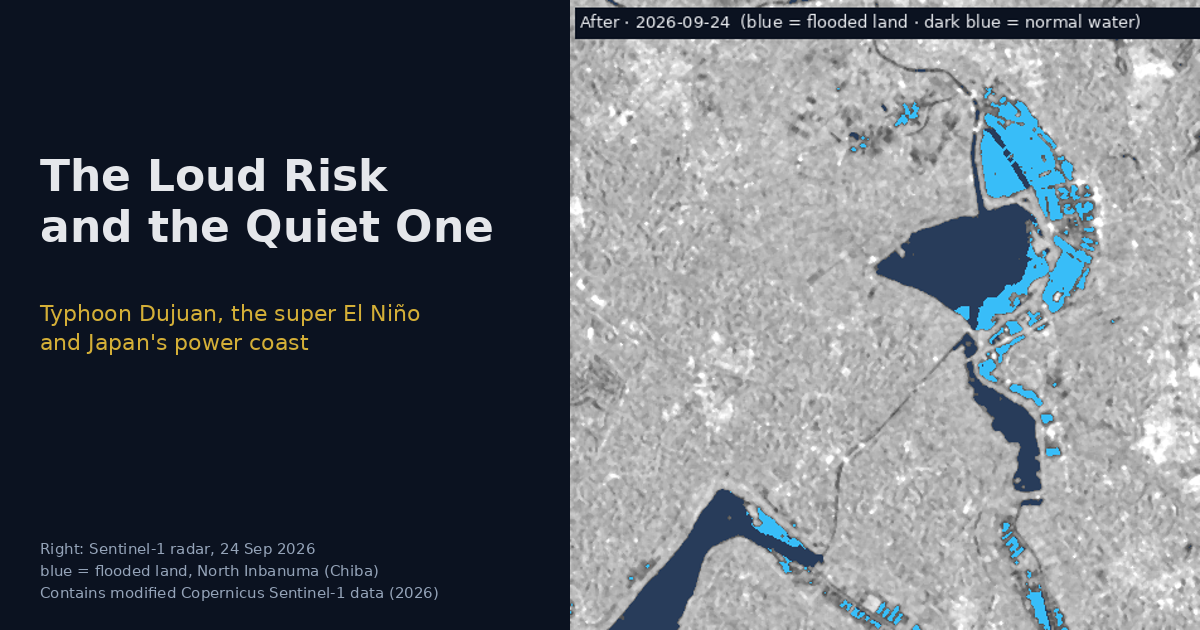
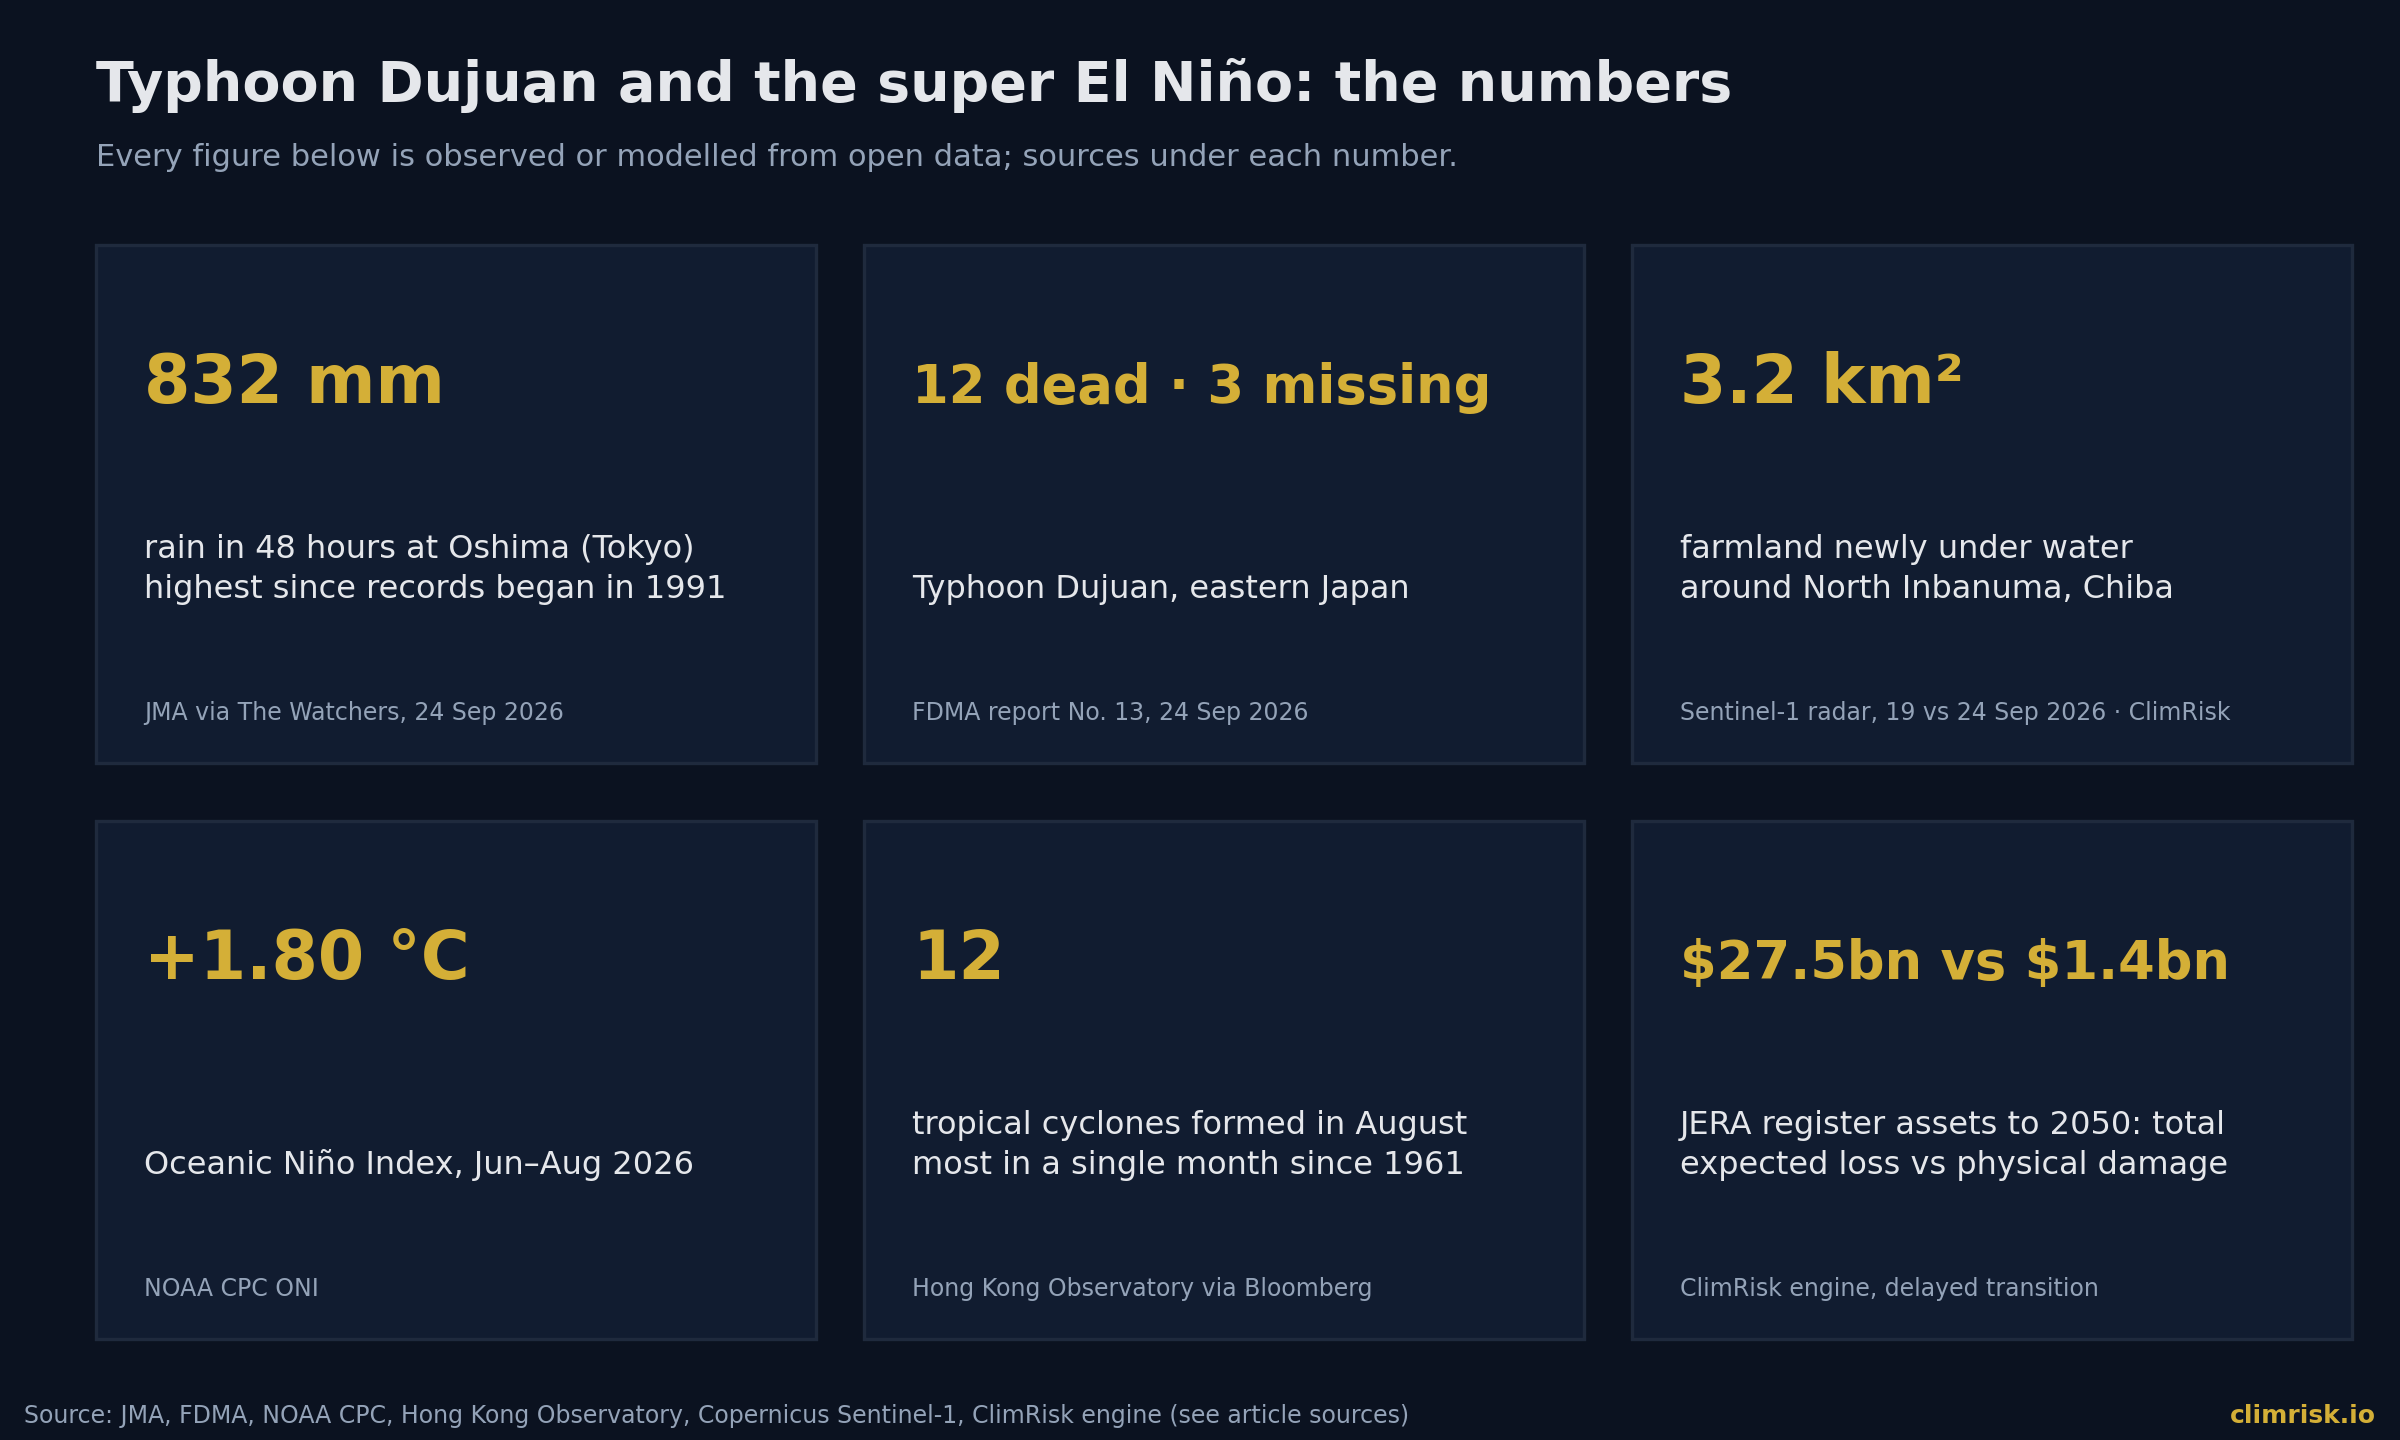
On 21 and 22 September 2026, Typhoon Dujuan — Japan's Typhoon No. 25 — passed the Izu Islands, skirted the Kanto region and moved out over the Pacific, leaving floods and landslides across eastern Japan. The Japan Meteorological Agency's station on Oshima, in Tokyo's Izu Islands, recorded 832 mm of rain in 48 hours, the highest total since the station's records began in 1991, beating the 824 mm set in October 2013. [JMA 2026] By 24 September, Japan's Fire and Disaster Management Agency counted 12 dead and three missing, seven of the deaths in Chiba. [FDMA 2026] More than 1.9 million people had been placed under evacuation orders at the storm's height. [BBC via CDP 2026]
In Chiba, about 100 metres of the North Inbanuma embankment failed near Funakata in Narita on 22 September, and further breaches followed on a drainage channel and on the Nagato River. [Chiba Prefecture / MLIT 2026]
That is the loud risk: visible, dated, counted. This piece is about the quieter one sitting next to it — and why, for the power plants that ring Tokyo Bay, the quiet one is nearly twenty times larger.
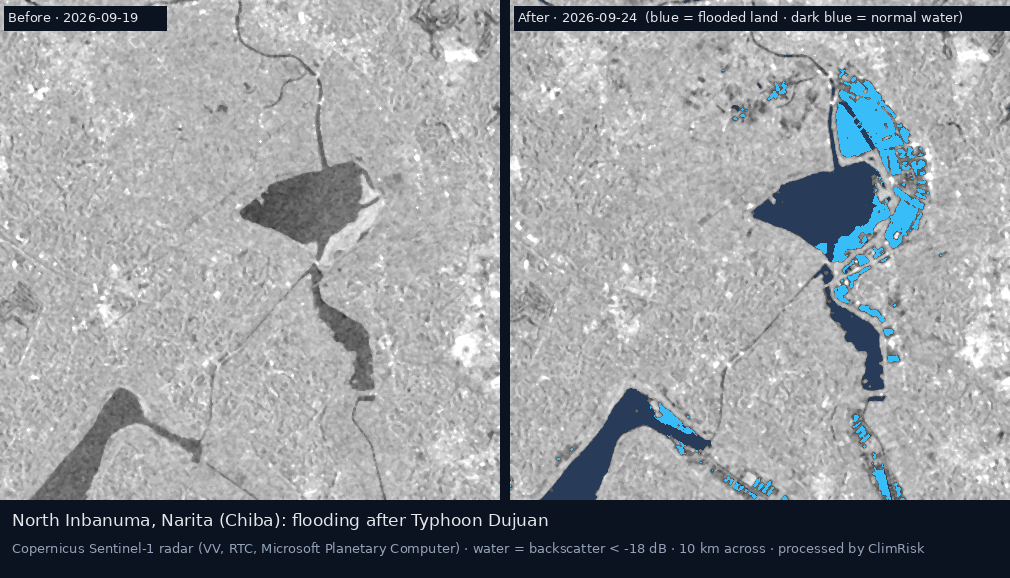
Optical satellites could not see the flooding: every Sentinel-2 pass over Chiba between 22 and 30 September was more than 20% cloud. Radar sees through cloud. Comparing the last Sentinel-1 pass before the storm (19 September) with the first after it (24 September), and excluding anything that was already water on any of four pre-storm passes or in ESA's WorldCover map, we measure 3.2 km² of newly flooded land in a 10 × 10 km window around North Inbanuma — the fields north and east of the lake, where the embankment failed.
Why the season is this busy
Dujuan did not arrive alone. The Hong Kong Observatory counted 12 tropical cyclones forming in August 2026, the most in a single month since 1961. [HKO via Bloomberg 2026] In China, three back-to-back storms in July alone caused an estimated $8.5 billion of direct economic losses, according to government statistics. [MEM via Bloomberg 2026] Maersk warned customers in September that recurring typhoons were congesting many of the region's busiest ports and cutting on-time vessel arrivals. [Maersk 2026]
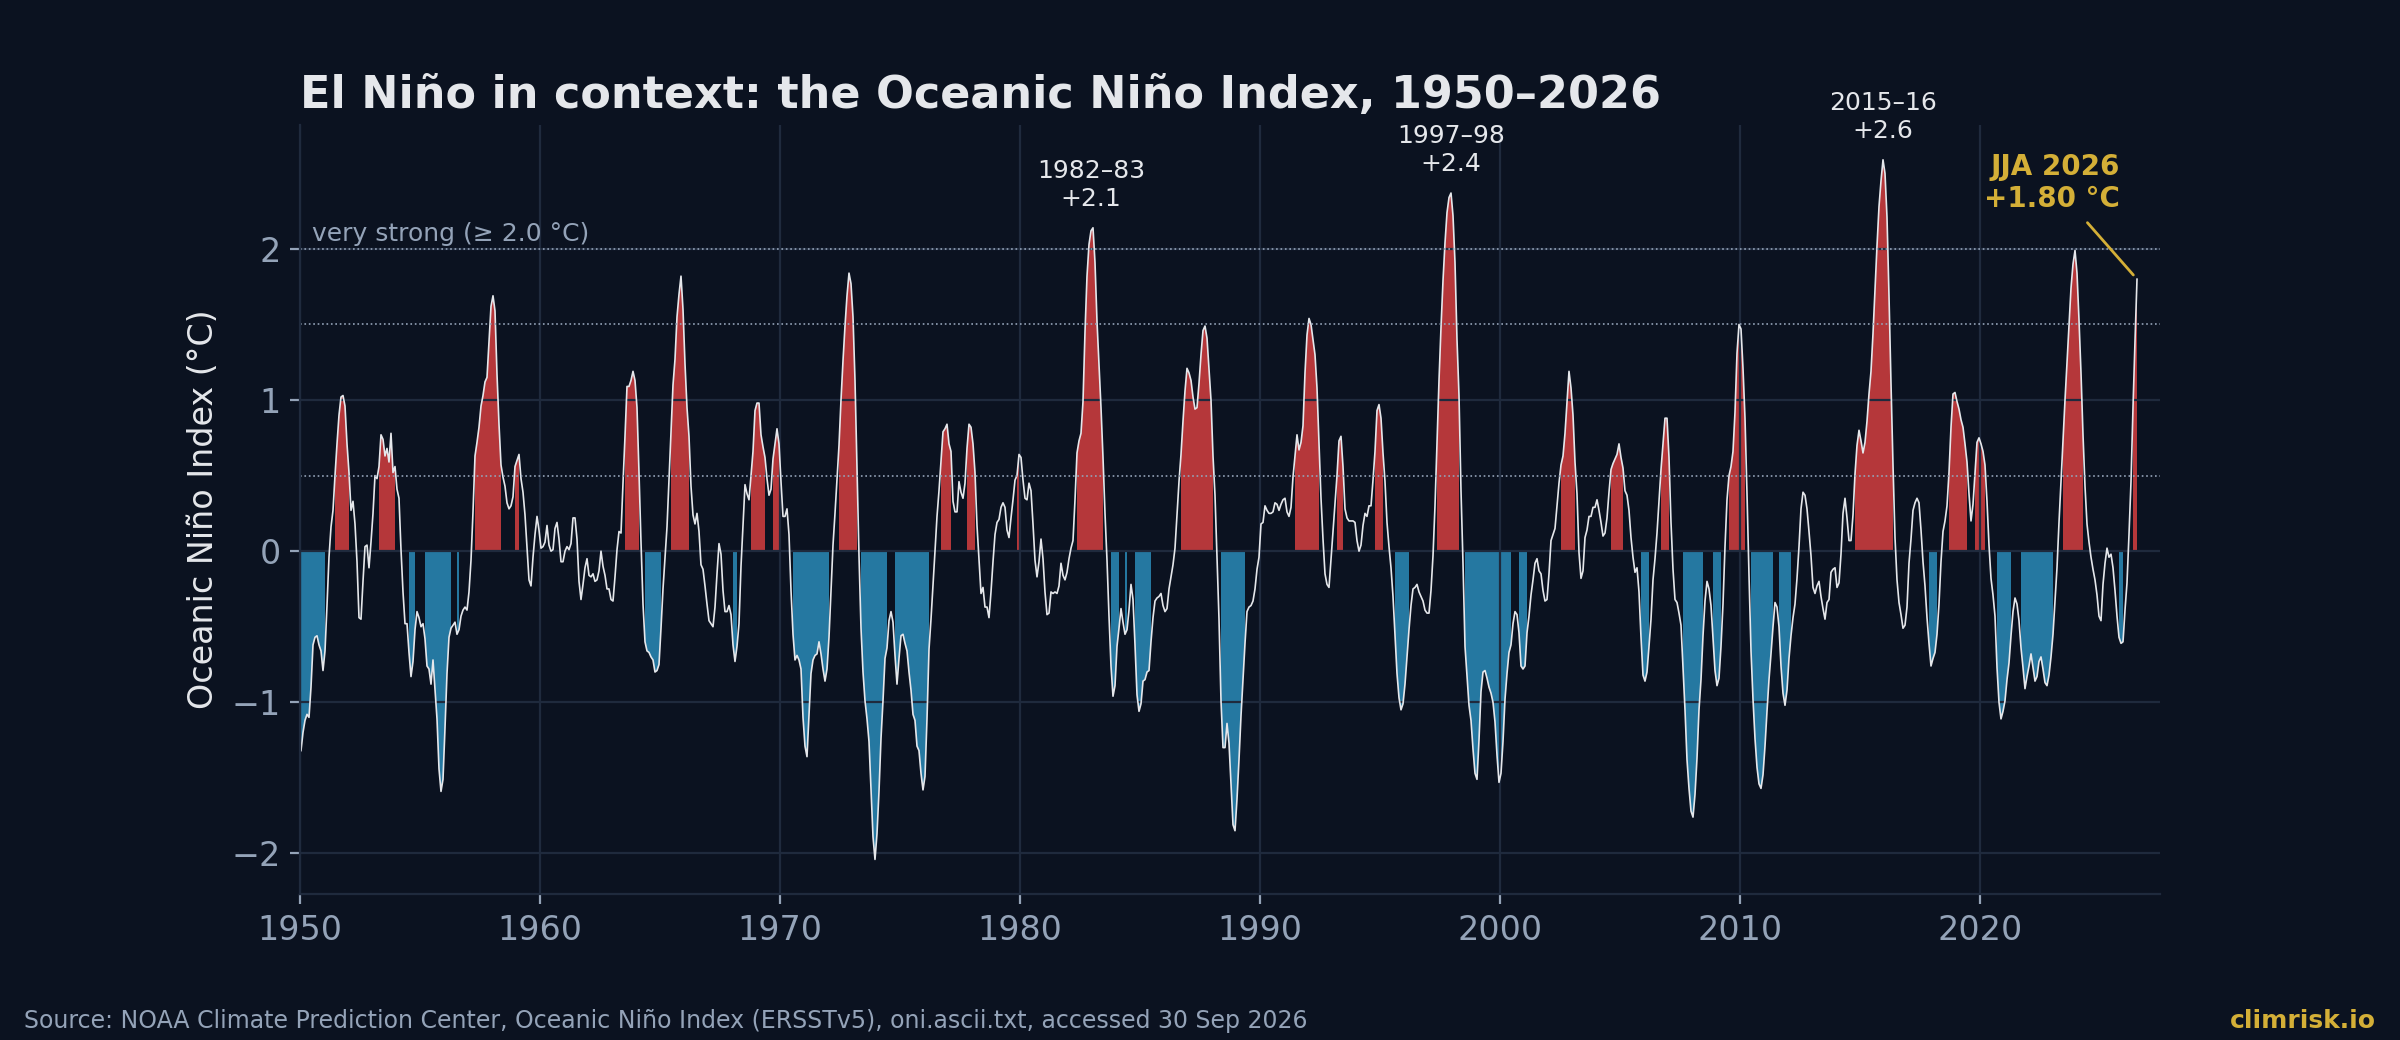
Forecasters link the activity to the El Niño building in the Pacific since June. The US Climate Prediction Center's September discussion puts it plainly:
SOURCE — NOAA CLIMATE PREDICTION CENTER, ENSO DIAGNOSTIC DISCUSSION, 10 SEPTEMBER 2026
"El Niño is strengthening, with a greater than 90% chance of a very strong event during the Northern Hemisphere fall and winter 2026-27." For October–December the agency gives a 75% chance of a historic event exceeding every El Niño since 1950.
The Oceanic Niño Index for June–August 2026 stood at +1.80 °C — already in strong-event territory, and still rising. [NOAA CPC 2026]
Japan's power coast
Tokyo Bay is lined with large thermal power stations. The asset register inside the ClimRisk engine — built from Climate TRACE ownership data — attributes 25 Japanese power plants to JERA, emitting about 125 million tonnes of CO₂e a year between them. Thirteen of them sit around Tokyo Bay and the Kanto coast.
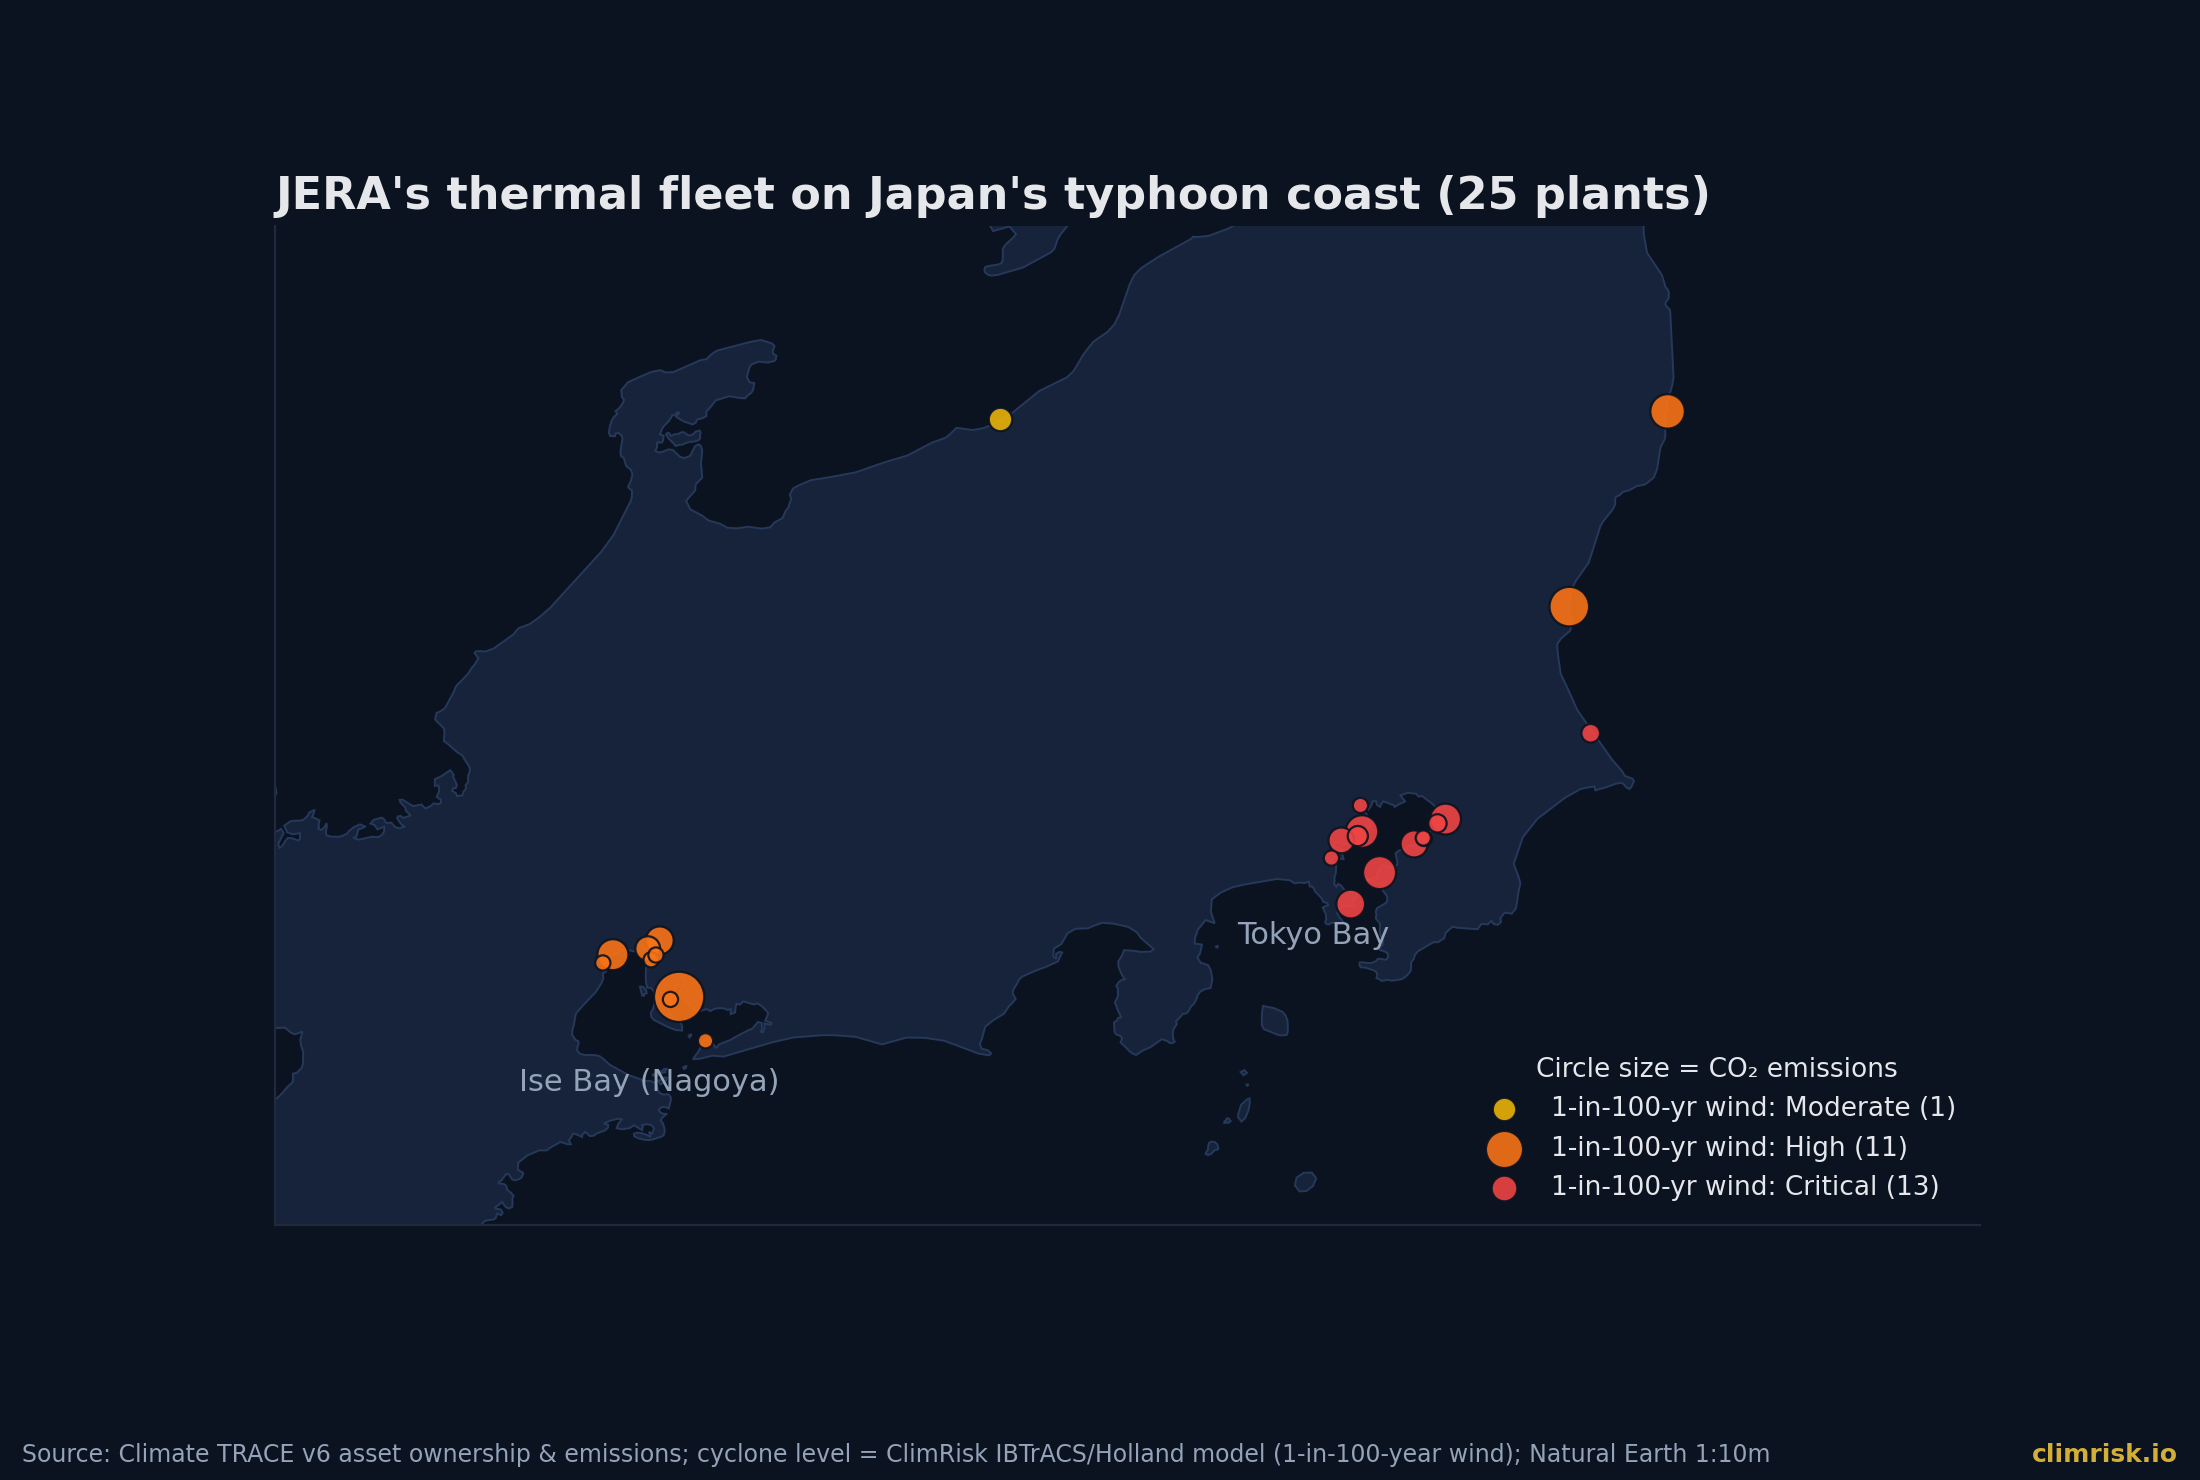
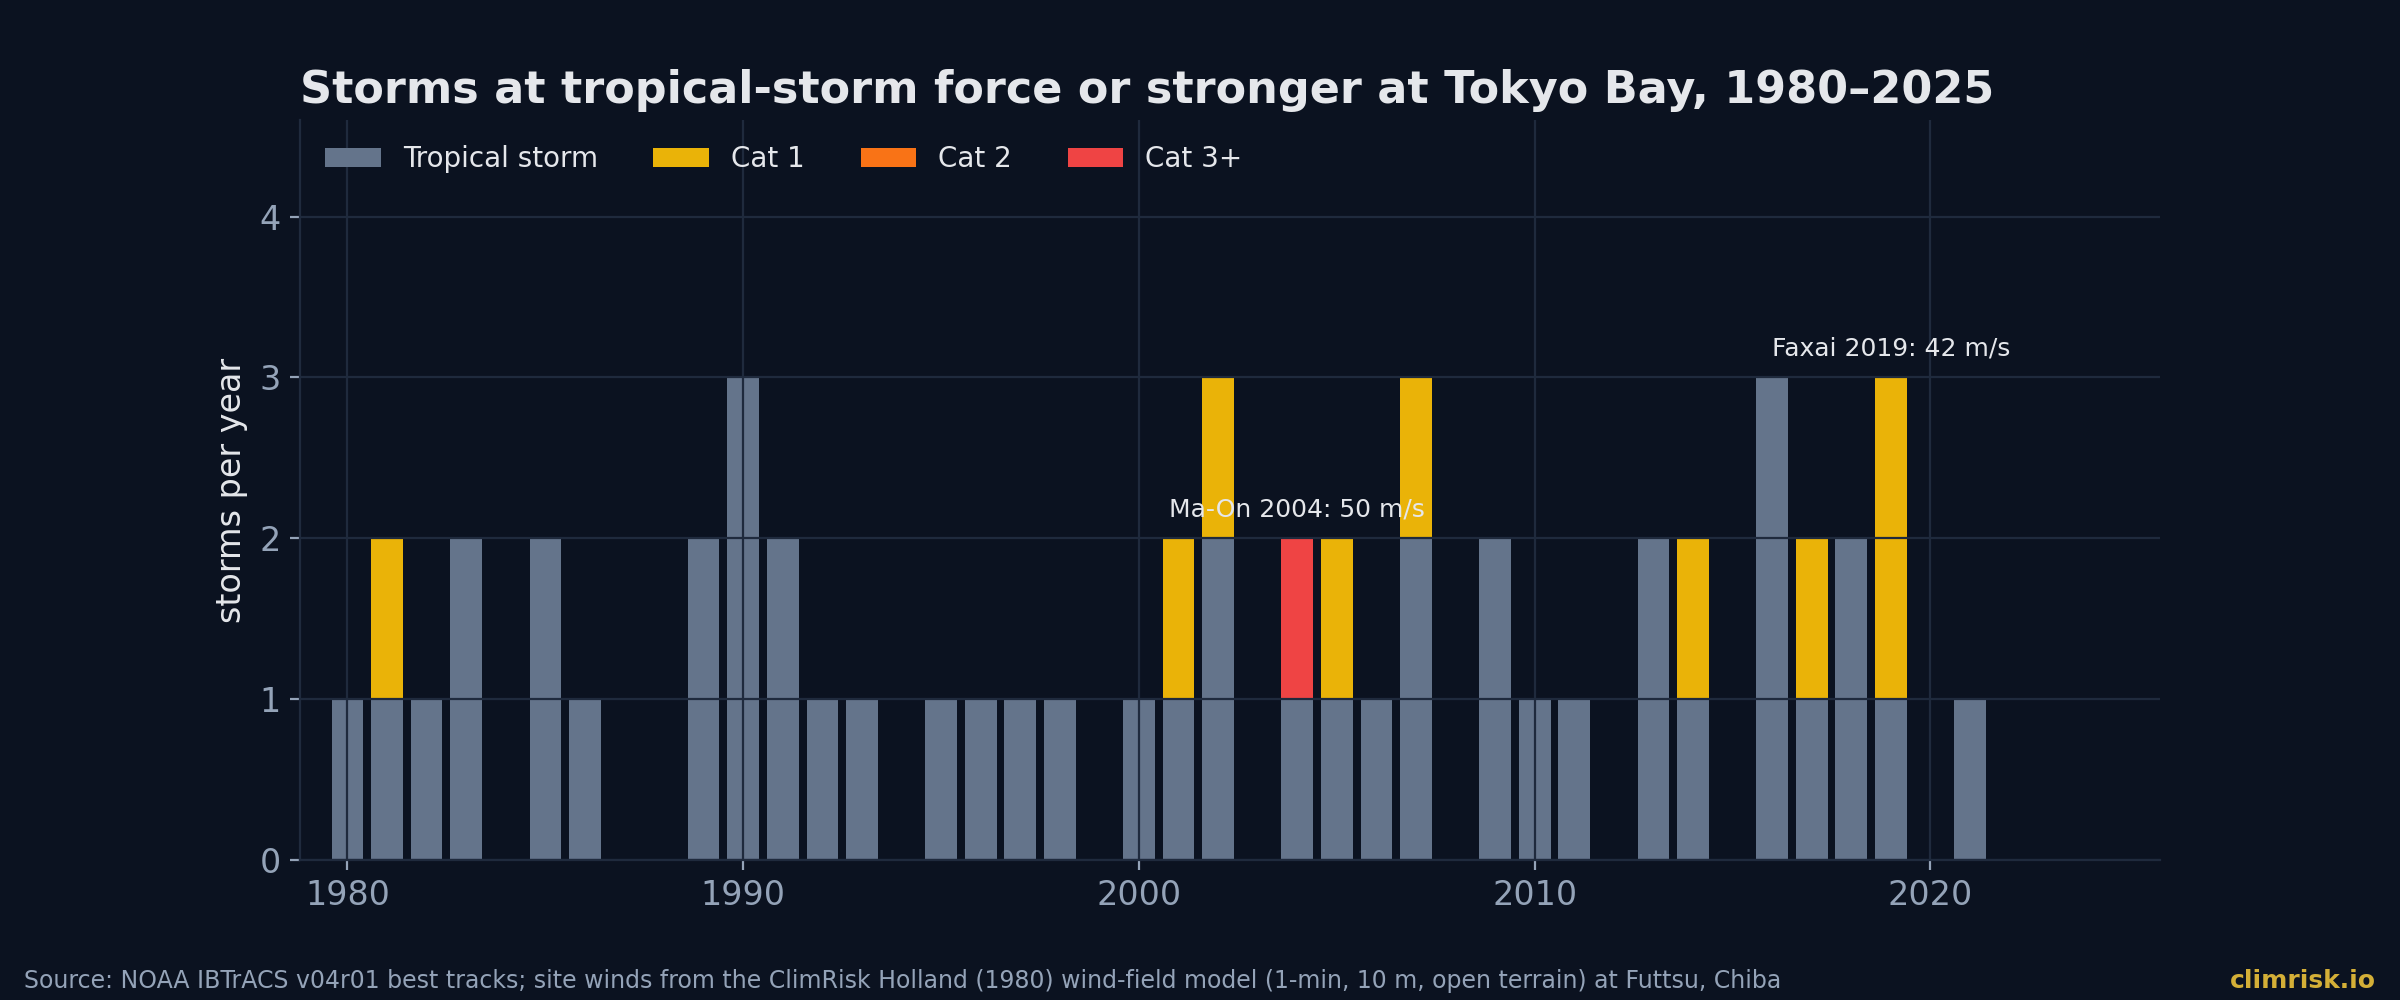
Our cyclone model reconstructs the wind at each site from every storm in NOAA's IBTrACS record since 1980. At Futtsu, on the eastern mouth of the bay, 55 storms have reached tropical-storm force since 1980 — 1.2 a year — and 10 reached hurricane (Category 1) force. The strongest was Ma-On in 2004 at about 50 m/s; Faxai in 2019 passed within 7 km at about 42 m/s. All 13 Kanto-coast plants fall in our highest band: a 1-in-100-year wind of about 60 m/s, the equivalent of a Category 4 hurricane (1-minute, 10 m, open terrain; weather stations typically read lower).
On hazard alone, this is one of the most exposed industrial coastlines on earth.
The loud risk, priced
Hazard is not loss. What matters to a lender or an owner is how much of a plant a storm actually destroys — and Japan is unusually good at not being destroyed. The damage curves we use were calibrated country-region by country-region against 38 years of reported disaster losses [Eberenz et al. 2021]; for Japan, Korea and Taiwan they imply that it takes far stronger winds to do the same damage as elsewhere in Asia — consistent with the region's building codes and engineering practice.
The result for Futtsu, a 5.3 GW gas-fired station:
- Expected annual damage: about 0.1% of replacement value — roughly $6 million a year on an estimated $6.4 billion plant.
- A 1-in-100-year storm year: about $160 million of damage.
- Flooding: negligible at the site. JRC river-flood maps show no inundation in the plant footprint up to the 1-in-500-year event, Deltares coastal maps show a few centimetres, and the FLOPROS database lists Chiba's flood defences at a 1-in-200-year standard. [JRC; Deltares; FLOPROS]
Dujuan's damage fell inland — embankments, slopes, farmland — not on the coastal plants. Across all 28 JERA assets in the register, we estimate physical damage at about $117 million a year, or $1.4 billion in present value to 2050. Real money, but not the headline.
The quiet risk
Japan's carbon price today is small. The World Bank's dashboard lists Japan's Global Warming Countermeasures Tax at about $1.80 per tonne, and notes that the mandatory GX-ETS began in April 2026 after the Diet passed the amended GX Promotion Act in 2025. [World Bank 2026] For a fleet emitting 125 million tonnes a year, what matters is where that price goes next.
We ran JERA's register assets through the ClimRisk Risk Analyst: today's policy, NGFS Phase 5 carbon prices and gas- and coal-power output for Japan's region in seven scenarios and three models, and 4,000 Monte Carlo draws covering carbon-cost pass-through, how much of a future carbon price reaches each plant, asset values, and storm and flood damage.
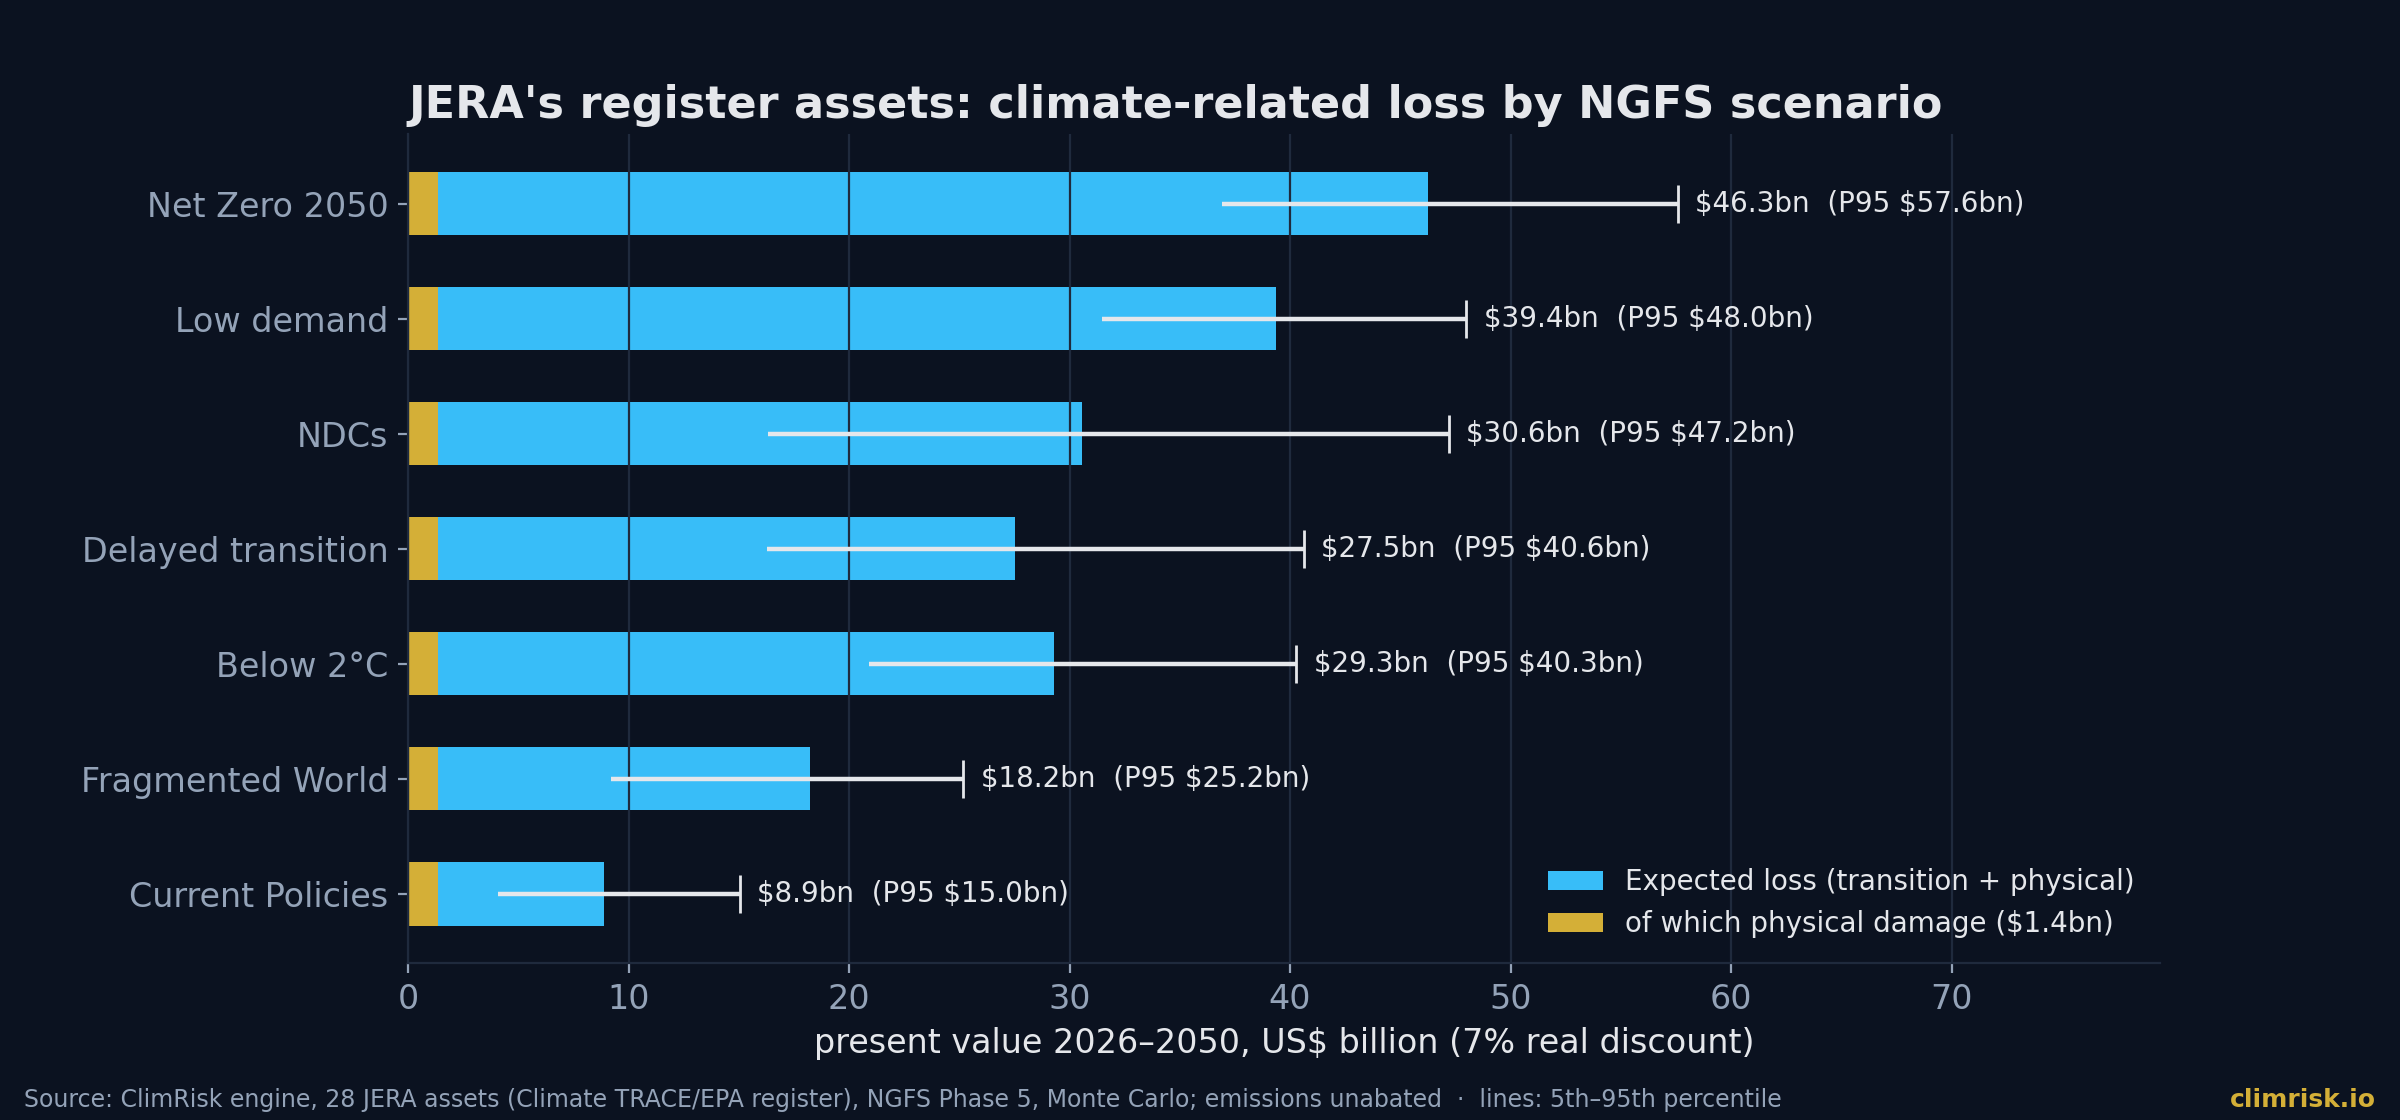
| NGFS scenario | Expected loss to 2050 (PV) | Share of estimated value | 95th percentile |
|---|---|---|---|
| Current Policies | $8.9bn | 9% | $15.0bn |
| Delayed transition | $27.5bn | 29% | $40.6bn |
| NDCs | $30.6bn | 32% | $47.2bn |
| Net Zero 2050 | $46.3bn | 49% | $57.6bn |
Physical damage is the same $1.4 billion in every row. Everything else is transition: carbon costs the fleet cannot pass on, and capital stranded as NGFS scenarios cut Japan's gas- and coal-fired output. Under a delayed transition, the quiet risk is nearly twenty times the loud one: $26 billion against $1.4 billion.
What this means
For lenders and investors in Japanese utilities. The typhoon season makes the news, but a thermal fleet's value hinges on the GX-ETS allocation rules and the path of Japan's carbon price. Stress tests that stop at physical risk miss most of the exposure. Ask how much of each plant's emissions will pay the full price, and when.
For operators. Physical resilience on the bay is largely engineered in; the weak points Dujuan exposed are inland — embankments, slopes, transmission corridors, fuel and port logistics. Maersk's congestion warnings are the supply-chain version of the same risk.
For everyone watching El Niño. NOAA expects the event to peak in October–December, and risk modellers quoted by Bloomberg expect further typhoon activity through October and perhaps into November. [Bloomberg 2026] That is not a Japan-specific forecast, but it is a reason to review storm-season preparedness across Asian supply chains now rather than after the next landfall.
Method and limitations
Cyclone hazard comes from IBTrACS best tracks since 1980, with a Holland (1980) wind field validated against measured station winds. Damage uses the Emanuel (2011) curve with regional parameters from Eberenz et al. (2021). Flood depths come from JRC CEMS-GloFAS (rivers) and Deltares (coast, including sea-level rise to 2050), with FLOPROS defence standards. Asset values are replacement-cost estimates from capacity and published build costs, not JERA's book values. Ownership and emissions come from Climate TRACE and may not match JERA's own reporting. Emissions are held at today's level, so the transition figures show the cost of not abating — JERA's decarbonisation plans would reduce them. Cyclone frequencies are historical; we have not added a climate-change or El Niño adjustment.
How ClimRisk measured this
The radar flood map, the storm history, the plant map and the scenario losses above were produced by the ClimRisk engine from open data: Copernicus Sentinel-1, NOAA IBTrACS, Climate TRACE, JRC, Deltares, FLOPROS, the World Bank Carbon Pricing Dashboard and NGFS Phase 5. The same Risk Analyst runs any plant or portfolio: physical hazard, the policies that apply, NGFS transition paths and a full loss distribution.
Sources
- The Watchers — Typhoon Dujuan leaves 12 dead and 3 missing (citing FDMA Report No. 13, MLIT, JMA, Kanagawa Prefecture), 24 Sep 2026
- FDMA — Typhoon No. 25 damage and fire-service response, Report No. 13 (Japanese)
- JMA — Oshima historical rainfall rankings
- MLIT Kanto Regional Development Bureau — emergency restoration of Inbanuma embankments (Japanese)
- Center for Disaster Philanthropy — Weekly disaster update, 21 Sep 2026 (citing BBC)
- Bloomberg via Insurance Journal — El Niño and Heat Fuel Destructive Storms Across Pacific Ocean, 21 Sep 2026
- Maersk — East Asia typhoon season: Update 1, 9 Sep 2026
- NOAA Climate Prediction Center — ENSO Diagnostic Discussion, 10 Sep 2026
- NOAA Climate Prediction Center — Oceanic Niño Index (ONI)
- NOAA NCEI — IBTrACS v04r01
- Eberenz, Lüthi & Bresch (2021), Regional tropical cyclone impact functions for globally consistent risk assessments, NHESS 21:393
- World Bank Carbon Pricing Dashboard (data release May 2026)
- NGFS Phase 5 scenarios via IIASA Scenario Explorer
- Copernicus Sentinel-1 RTC via Microsoft Planetary Computer
- Climate TRACE — asset ownership and emissions
- JRC CEMS-GloFAS global river flood hazard maps
- Deltares Global Flood Maps (coastal)
- Scussolini et al. (2016), FLOPROS: an evolving global database of flood protection standards, NHESS 16:1049
ClimRisk translates physical and transition climate risk into asset-level financial exposure. To run your own assets or portfolio through the engine, write to shri@climrisk.io or book a demo.